


Dow Jones Talking Points:
- US Equities have continued to pullback after the Tuesday run up to fresh highs. In Dow futures, support showed after the US close on Tuesday afternoon; but that strength was soon faded after the US open yesterday. This equates to two consecutive days of indecision following a false-breakout at fresh six-month-highs, and this may be preluding a deeper pullback in the index before the longer-term bullish trend is ready for continuation.
- We looked at two short-term support levels in our Tuesday article combined with an area of interest for longer-term, bigger-picture plays. The first level helped to support prices into yesterday’s open, but a day later and sellers have pushed right back to this area on the chart. This would de-emphasize the attractiveness of the second zone of support potential around 25,500, while the deeper level with longer-term potential remains of interest around 25,370.
- DailyFX Forecasts on a variety of currencies such as the US Dollar or the Euro are available from the DailyFX Trading Guides page. If you’re looking to improve your trading approach, check out Traits of Successful Traders. And if you’re looking for an introductory primer to the Forex market, check out our New to FX Guide.
Do you want to see how retail traders are currently trading the US Dollar? Check out our IG Client Sentiment Indicator.
Dow Jones Pullback Continues
US stocks are continuing to hold on to the pullback that started to show a couple of days ago. This happened shortly after the S&P 500 set a fresh all-time-high while the Dow Jones Industrial Average set a new six-month high on Tuesday of this week. In our Tuesday article, we looked at the prospect of bullish continuation in the index, focusing-in on two key areas of short-term support at 25,695 and 25,550, respectively. The first of those levels came into play after the US equity close on Tuesday afternoon, and prices soon moved-higher. But that enthusiasm again showed signs of waning around yesterday’s US open, and prices have continued to retrace since.
Dow Jones Hourly Price Chart: Support Bounce Falters as Pullback Continues

Chart prepared by James Stanley
At this stage, the concern would be one of a bigger-picture basis as price action on the Daily is starting to show signs slowing down after an inability to sustain the breakout to fresh six-month highs. We’ve now seen two consecutive days of indecision on the Daily chart, and given the context with which we had coming into the move, that’s not a positive for Dow bulls.
This highlights the potential for a deeper pullback, and this brings to question the viability of that second area of support potential we looked at on Tuesday. For traders looking to address the Dow in a less aggressive manner, a more attractive area of potential support exists a bit-lower on the chart, around the 14.4% Fibonacci retracement of the post-election move in the index. This was also the June swing-high, and this price action has shown a few different iterations of short-term support and resistance over the past month.
Dow Jones Daily Price Chart: Pullback Potential After Two Days of Indecision Followed Failed Breakout
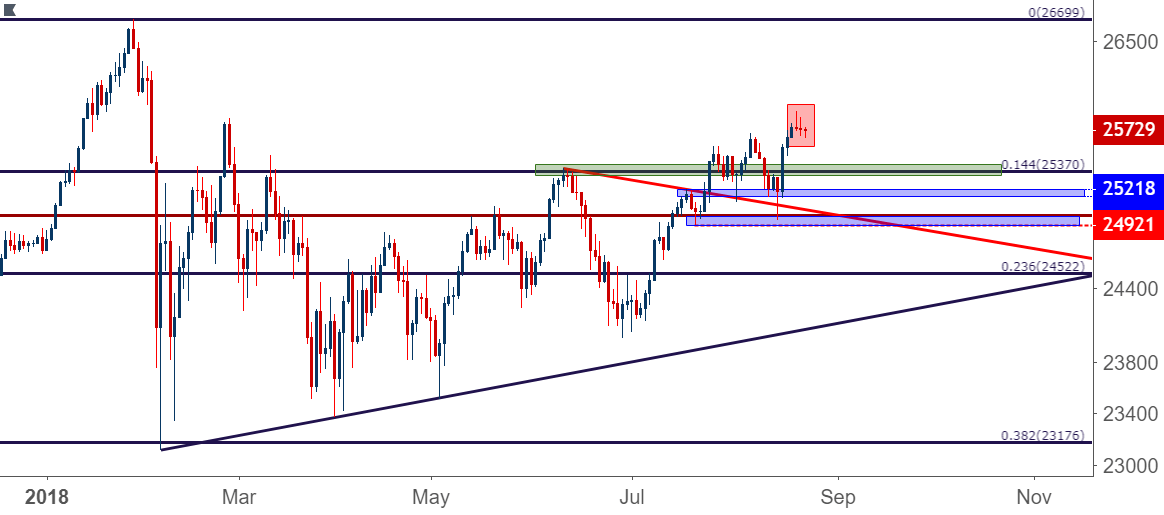
Chart prepared by James Stanley
To read more:
Are you looking for longer-term analysis on the U.S. Dollar? Our DailyFX Forecasts for Q3 have a section for each major currency, and we also offer a plethora of resources on USD-pairs such as EUR/USD, GBP/USD, USD/JPY, AUD/USD. Traders can also stay up with near-term positioning via our IG Client Sentiment Indicator.
Forex Trading Resources
DailyFX offers a plethora of tools, indicators and resources to help traders. For those looking for trading ideas, our IG Client Sentiment shows the positioning of retail traders with actual live trades and positions. Our trading guides bring our DailyFX Quarterly Forecasts and our Top Trading Opportunities; and our real-time news feed has intra-day interactions from the DailyFX team. And if you’re looking for real-time analysis, our DailyFX Webinars offer numerous sessions each week in which you can see how and why we’re looking at what we’re looking at.
If you’re looking for educational information, our New to FX guide is there to help new(er) traders while our Traits of Successful Traders research is built to help sharpen the skill set by focusing on risk and trade management.
--- Written by James Stanley, Strategist for DailyFX.com
Contact and follow James on Twitter: @JStanleyFX


