Talking Points:
- EUR/JPY has moved back to a key Fibonacci level over the past week, and has seen a build of support that led into a topside push to start off this week. That strength was short-lived, however, as sellers came back earlier this morning to drive prices right back down to Fibonacci support at 128.52.
- While themes of Euro strength and Yen weakness drove the bullish trend for much of last year, those dynamics have recently begun to shift and we may be on the verge of a deeper reversal, particularly if the recent item regarding options around stimulus taper at the Bank of Japan end up coming to fruition.
- DailyFX Forecasts on a variety of currencies such as the US Dollar or the Euro are available from the DailyFX Trading Guides page. If you’re looking to improve your trading approach, check out Traits of Successful Traders. And if you’re looking for an introductory primer to the Forex market, check out our New to FX Guide.
Do you want to see how retail traders are currently trading the Euro or the Japanese Yen? Check out our IG Client Sentiment Indicator.
EUR/JPY Reversal of the 2017 Bullish Trend
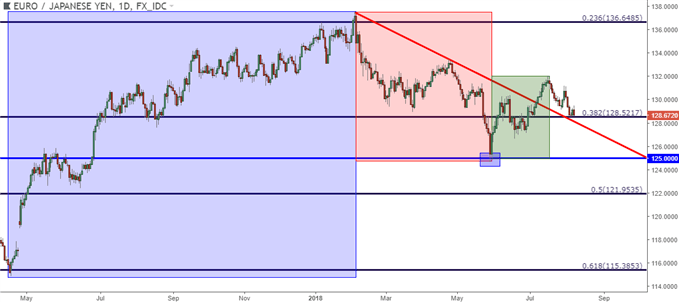
It’s been an active past couple of weeks in EUR/JPY, as a series of key drivers have helped to push prices in the pair in both directions; and this is somewhat of a sampling of what price action has been doing over the past year-and-a-half in EUR/JPY.
Coming into 2018, the pair was continuing to rally as the Euro remained strong, driven in-large part by expectations for a hawkish shift at the ECB. Meanwhile, the Yen remained weak as the BoJ was expected to remain loose and passive, creating a symbiotic setup in EUR/JPY that supported the bullish advance. That theme reversed in early-February, and the bearish price action in EUR/JPY remained until the end of May – all the way until the 125.00 psychological level came into play. The month of June and the first half of July saw the pair get back to its bullish ways, eventually eclipsing the 130.00 psychological level again, and that’s about the time that another shift began to show in the pair.
EUR/JPY Daily Price Chart: Return of Bulls Cut Short in Mid-July

Chart prepared by James Stanley
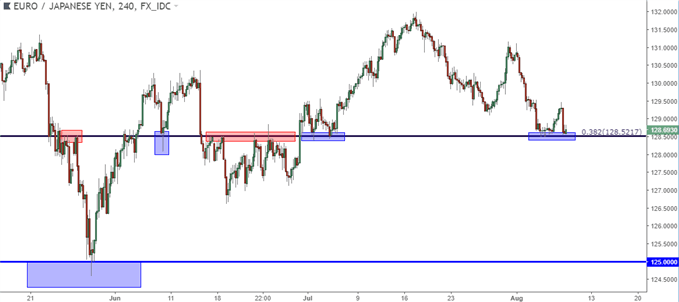
The ECB’s rate decision in late-July brought upon another leg of Euro weakness in the pair, and more recently we’ve seen Yen-strength becoming more of a concern as indications appear to point to the BoJ moving closer to a stimulus-taper strategy of their own. This has sent prices spiraling lower so far in the month of August, but over the past couple of days a key support level has come into play at 128.52, as this is the 38.2% Fibonacci retracement of the 2012-2014 major move in EUR/JPY. This level had previously helped to set support in July and August of last year, and more recently this price has come back into play as short-term resistance in late-June and then again as support in early-July and early-August.
EUR/JPY Four-Hour Price Chart

Chart prepared by James Stanley
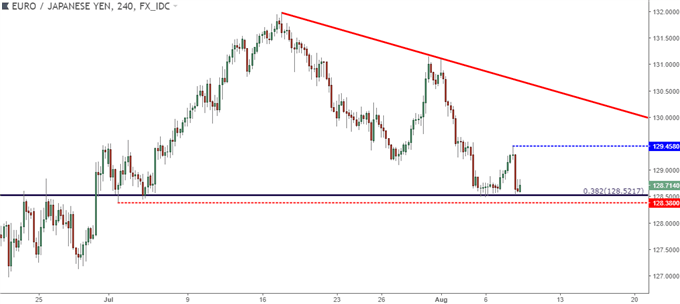
At this stage, macro forces would appear to be at odds with bullish reversal plays in the pair, and given the build of support at this key level on the chart over the past week, traders can look to bearish breakouts should new lows print below the Fibonacci level. For those that do want to look at bullish strategies in the pair, they would likely want to wait for some element of confirmation that bulls may be able to shift the tides here. For those looking to move forward with aggressive bullish strategies, a test above this week’s swing high can begin to open the door for a re-test of the bearish trend-line taken from the July and August swing highs in EUR/JPY.
EUR/JPY Four-Hour Price Chart

Chart prepared by James Stanley
To read more:
Are you looking for longer-term analysis on the U.S. Dollar? Our DailyFX Forecasts for Q3 have a section for each major currency, and we also offer a plethora of resources on USD-pairs such as EUR/USD, GBP/USD, USD/JPY, AUD/USD. Traders can also stay up with near-term positioning via our IG Client Sentiment Indicator.
Forex Trading Resources
DailyFX offers a plethora of tools, indicators and resources to help traders. For those looking for trading ideas, our IG Client Sentiment shows the positioning of retail traders with actual live trades and positions. Our trading guides bring our DailyFX Quarterly Forecasts and our Top Trading Opportunities; and our real-time news feed has intra-day interactions from the DailyFX team. And if you’re looking for real-time analysis, our DailyFX Webinars offer numerous sessions each week in which you can see how and why we’re looking at what we’re looking at.
If you’re looking for educational information, our New to FX guide is there to help new(er) traders while our Traits of Successful Traders research is built to help sharpen the skill set by focusing on risk and trade management.
--- Written by James Stanley, Strategist for DailyFX.com
Contact and follow James on Twitter: @JStanleyFX


