


GBP/USD Talking Points:
- The British Pound has continued to sell-off after the BoE rate hike that took place earlier in August. Prices in the pair have continued to be offered-lower as the dual themes of Brexit and a dovish BoE have removed rationale for bulls to defend the bid. At this point, the most bullish aspect of GBP/USD appears to be just how entrenched this sell-off has become.
- GBP/USD is flashing oversold readings on the Daily chart and retail traders continue to try to pick a bottom with IG Client Sentiment showing a read of +2.78 as of this writing. Given the contrarian nature of the indicator, this would point to the potential for further downside in the pair.
- Quarterly Forecasts have just been updated, and the Q3 forecast for GBP/USD is available from the DailyFX Trading Guides Page. If you’re looking to improve your trading approach, check out Traits of Successful Traders. And if you’re looking for an introductory primer to the Forex market, check out our New to FX Guide.
Want to see how retail traders are currently trading GBP/USD? Click here for GBP/USD Sentiment.
Cable Crush Continues to Fresh 2018 Lows
The past week and a half has produced a rather aggressive sell-off in the British Pound, and this continues a theme that’s been active since mid-April. As we traded into Q2, the British Pound was holding on to some considerable strength from last year, largely built upon the basis of expectations for higher rates and hawkish policy from the Bank of England.
But as we traded deeper into the year that case for hawkish policy and higher rates has eroded. This started in mid-April when we looked at GBP/USD pulling back after a disappointing inflation print. And since then, both inflation and price action in GBP/USD has been in drawdown; matters haven’t been helped by the impending risk around Brexit negotiations between the EU and UK set for just a couple of months away now.
This came to light in early-August at the Bank of England’s ‘Super Thursday’ rate decision. Markets were ready for a rate hike as that had been widely telegraphed by the Bank of England, but the contextual details offered by the bank offered a fairly pessimistic take on future operating conditions, forecasting one potential rate hike ahead of the year 2020. And at that point, the one reason for bulls to defend the bid, the prospect of tighter policy in response to above-target inflation was removed from the equation. What’s taken place in price action since that rate decision has not been pretty for Cable bulls.
GBP/USD Daily Price Chart: Hastening of Sell-Off as RSI Goes Oversold (Again)
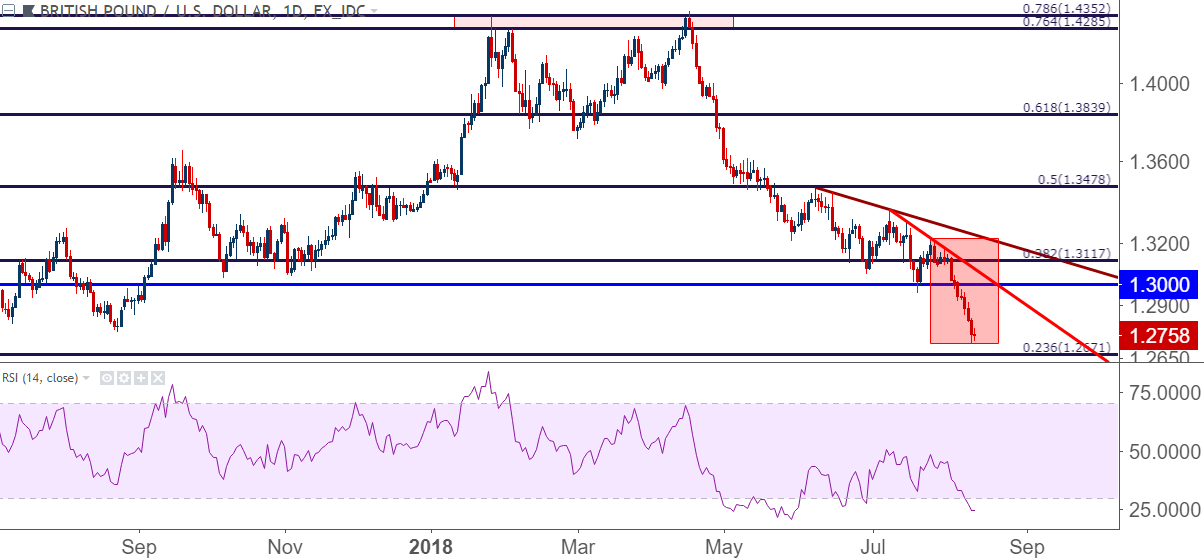
Chart prepared by James Stanley
July UK Inflation Numbers Are Set to Be Released on Wednesday Morning
This week’s economic calendar brings an item of interest for GBP/USD traders as we have the July release of inflation numbers. This data point has very much been a driver of British Pound price action as this was the reason for the build of expectations for a more-hawkish Bank of England.
DailyFX Economic Calendar: UK Inflation to be Released on Wednesday Morning
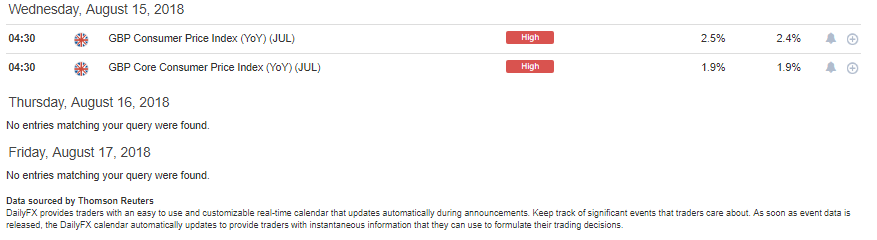
Chart prepared by James Stanley
Inflation as the Push Point
Inflation ballooned in the UK in 2017, largely in response to the ‘sharp repricing’ in the value of the British Pound around the Brexit referendum. After Brexit, and the ensuing dovish campaign from the Bank of England, the British Pound went into a ‘flash crash’ in October of 2016 as a dearth of demand was unable to offset the considerable selling pressure.
But – in response to that massive sell-off, retailers began to raise prices, particularly importers that didn’t want to take a 20% haircut on revenues out of the UK simply because of a weaker British Pound; and this started to show through inflation figures. As we came into 2018, the general expectation appeared to be for the Bank of England to shift into a more-hawkish stance to stem this inflation; but market forces started to take care of the job before the BoE could ever make much ground. Inflation fell to 2.7% in February. And then to 2.5% in March. And then we had three consecutive months at 2.4%. So, it would appear that inflation has started to soften on its own, which is what led to the dovish case made by the BoE at last week’s rate hike.
UK Inflation Softening in 2018 After Five Consecutive Months At-or-Above 3%

Chart prepared by James Stanley
Bearish Continuation Potential – Can Inflation Give a Blip of Strength to Sell Into?
At this point, it appears as though the British Pound is nearing a backdrop similar to what happened after the Brexit referendum. This is when that dearth of demand led into the Flash Crash, and while forecasting another scenario of that nature would be impossible, this does appear to be a situation that can lend itself to further selling. Brexit is likely to remain an overhanging concern, and it doesn’t appear that we’re going to get any element of clarity there until September, at the absolute earliest. Rate policy at the Bank of England is now considered to be dovish after last week’s rate decision, and given the continued draw on inflation – there has been little reason for market participants to question that stance.
This combination of negative factors is likely the reason behind the current posture in GBP/USD, where the pair has been sitting on fresh yearly lows since the European open on Friday morning. This makes selling problematic, as we have oversold RSI readings on the Daily chart combined with this short-term build of support; and there are no nearby areas of resistance to use for stop placement.
This can help to highlight, however, zones that could be attractive for bearish continuation strategies in GBP/USD. Below, we look at two such areas on the chart, the first of which runs from a group of swing lows taken from last week around 1.2817 up to 1.2846. A bit deeper, we have another potential resistance area that runs from 1.2918 up to 1.2956. If we break back-above the 1.3000 level, traders would want to question the bearish continuation approach as something in the backdrop would’ve likely changed.
GBP/USD Hourly Price Chart: Lower-High Resistance Potential for Bearish Continuation

Chart prepared by James Stanley
To read more:
Are you looking for longer-term analysis on the U.S. Dollar? Our DailyFX Forecasts for Q1 have a section for each major currency, and we also offer a plethora of resources on USD-pairs such as EUR/USD, GBP/USD, USD/JPY, AUD/USD. Traders can also stay up with near-term positioning via our IG Client Sentiment Indicator.
Forex Trading Resources
DailyFX offers a plethora of tools, indicators and resources to help traders. For those looking for trading ideas, our IG Client Sentiment shows the positioning of retail traders with actual live trades and positions. Our trading guides bring our DailyFX Quarterly Forecasts and our Top Trading Opportunities; and our real-time news feed has intra-day interactions from the DailyFX team. And if you’re looking for real-time analysis, our DailyFX Webinars offer numerous sessions each week in which you can see how and why we’re looking at what we’re looking at.
If you’re looking for educational information, our New to FX guide is there to help new(er) traders while our Traits of Successful Traders research is built to help sharpen the skill set by focusing on risk and trade management.
--- Written by James Stanley, Strategist for DailyFX.com
Contact and follow James on Twitter: @JStanleyFX


