


US Dollar Price Action Setups After USD Support Test Gets Underway
In this webinar, we used price action to look at macro markets as the US Dollar continued the pullback that started last week. In our webinar on Thursday, we looked at that pullback from various angles, and on the following day we published our FX setups for this week, two of which were looking to work with USD-weakness to go along with a short-side setup in EUR/USD. At this stage, EUR/USD has already rallied through two of the three zones and the third has started to come into play around the 1.1600-handle.
Talking Points:
- If you’re looking to improve your trading approach, our Traits of Successful Traders research could help. This is based on research derived from actual results from real traders, and this is available to any trader completely free-of-charge.
- If you’re looking for a primer on the FX market, we can help. To get a ground-up explanation behind the Forex market, please click here to access our New to FX Trading Guide.
If you’d like to sign up for our webinars, we host an event on Tuesday and Thursday, each of which can be accessed from the below links:
Tuesday: Tuesday, 1PM ET
Thursday: Thursday 1PM ET
US Dollar Continues to Drop Deeper into Support Zone
We looked at the US Dollar beginning to test a key support zone earlier this morning, and that pullback has hastened throughout today’s session as prices have fallen deeper into the zone. As we wrote this morning, there are two specific areas of interest within this zone: At 95.00 we have the psychological level that was a previous swing-high from the month of May, and a bit lower, currently projecting around 94.75, we have the bullish trend-line that had caught support ahead of the August breakout. Each of these support areas re-open the door for bullish strategies in the US Dollar.
US Dollar Four-Hour Price Chart
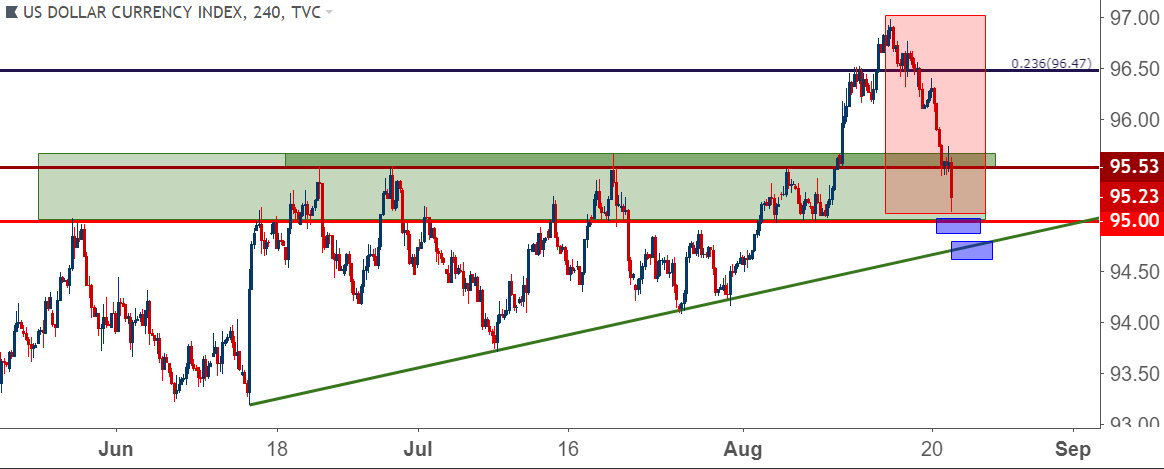
Chart prepared by James Stanley
Despite the veracity with which this sell-off has come-in, the longer-term trend remains bullish in the US Dollar, and this will likely remain as the case until that bullish trend-line is taken out, at the earliest.
US Dollar Daily Price Chart
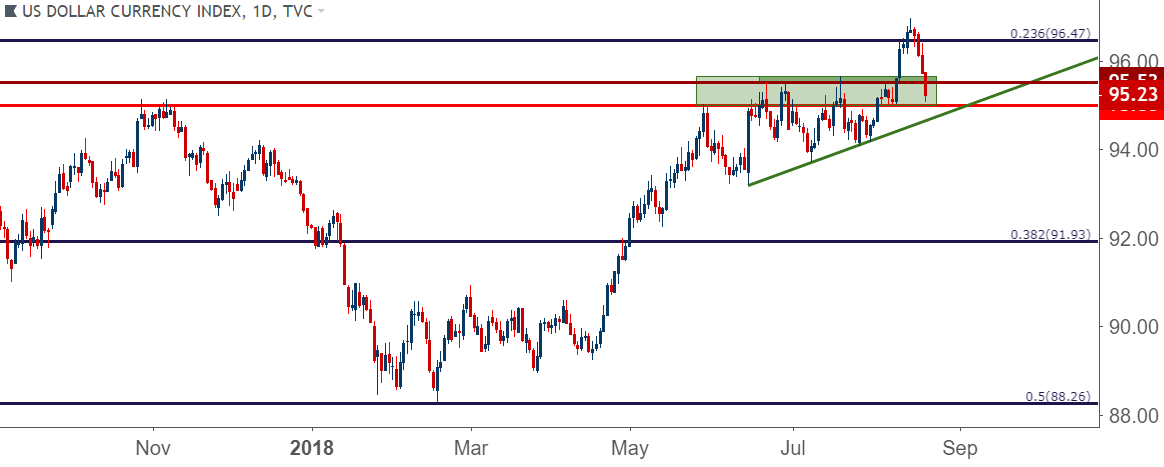
Chart prepared by James Stanley
EUR/USD Bursts Through Two Resistance Zones – Can 1.1625 Stop the Advance?
The bulk of the bearish move in EUR/USD took place in the month of May. After that, we were merely moving back down to prior support. The 1.1500 breakout didn’t happen until a couple of weeks ago when fears around contagion in European banking started to crop up, and that helped to push the pair down to as low as 1.1300, which came into play last Wednesday. Prices have since started to retrace, and the bullish retracement in the Euro appeared to heat up today to help push prices back-above the 1.1500 handle.
After catching a bit of resistance around 1.1525 this morning, bulls extended the move, and we’re now coming off after a test of the ‘r3’ zone of resistance we looked at in our FX Setups for the Week of August 20, 2018. In the webinar, we looked at how to evaluate resistance on a shorter-term basis to open the door for bearish re-entry after the zone has started to come into play.
EUR/USD Four-Hour Price Chart
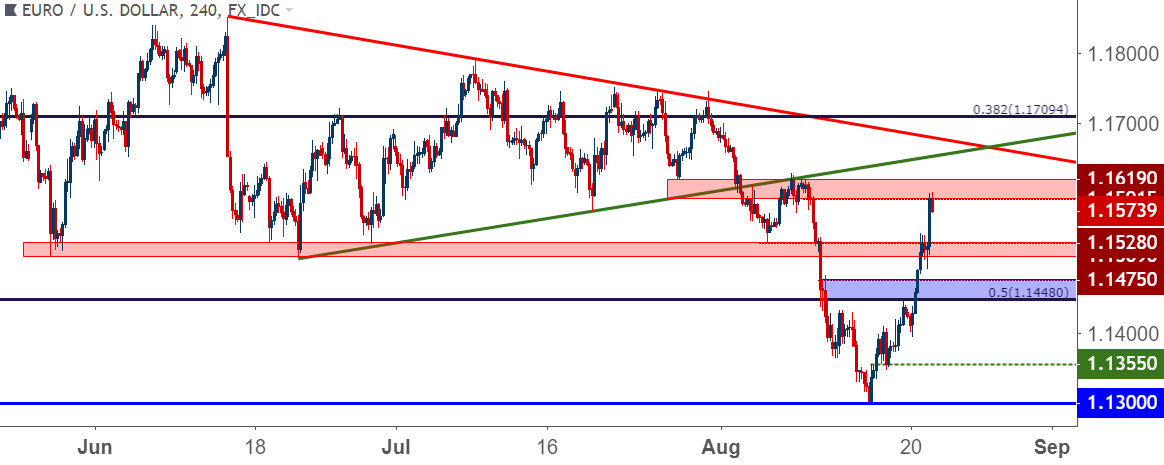
Chart prepared by James Stanley
GBP/USD Squeezed Up to R2
We had looked at topside plays in GBP/USD as part of this week’s FX Setups. We were looking for an initial move into the ‘r1’ zone we had looked at over the past two weeks, with a secondary target set towards a group of prior swing lows that runs from 1.2918-1.2956. We discussed this theme again in yesterday’s article entitled, GBP/USD: Oversold Cable Begins Bounce From Fibonacci Support.
This is an area where shorts can begin to become attractive should resistance actually begin to show. There’s no sign of that yet as prices have just run up to the second zone of resistance that we’re following; but proximity to 1.3000 and the bearish trend-line taken from the July highs can keep the door open for short-side setups if sellers start to show in this area over the next day.
GBP/USD Four-Hour Price Chart: Cable Begins to Find Resistance in ‘R2’ Zone
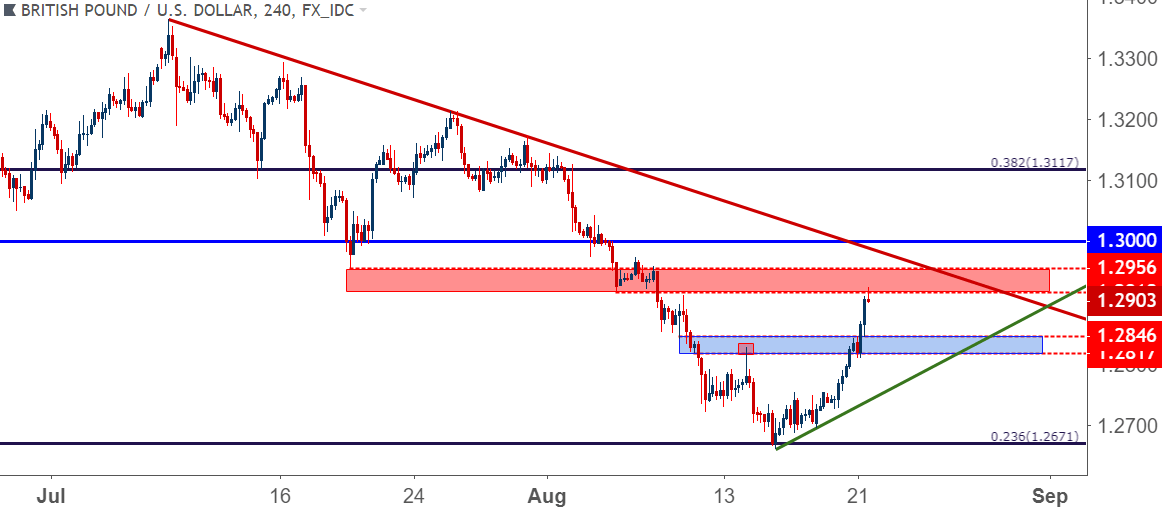
Chart prepared by James Stanley
AUD/USD Bounces From Confluent Support to 2018 Trend-Line
This is similar to GBP/USD looked at above, as we came into this week looking at counter-trend themes to drive near-term price action. Last Thursday we had looked at a big level of confluent support in AUD/USD around the .7200 handle. This area had turned around two very aggressive bearish advances in May and again in December of 2016.
In our FX Setups for this week, we looked at AUD/USD topside plays up to the bearish trend-line that’s held the highs in the pair so far this year. That currently projects to the .7400 area on the chart.
AUD/USD Weekly Price Chart
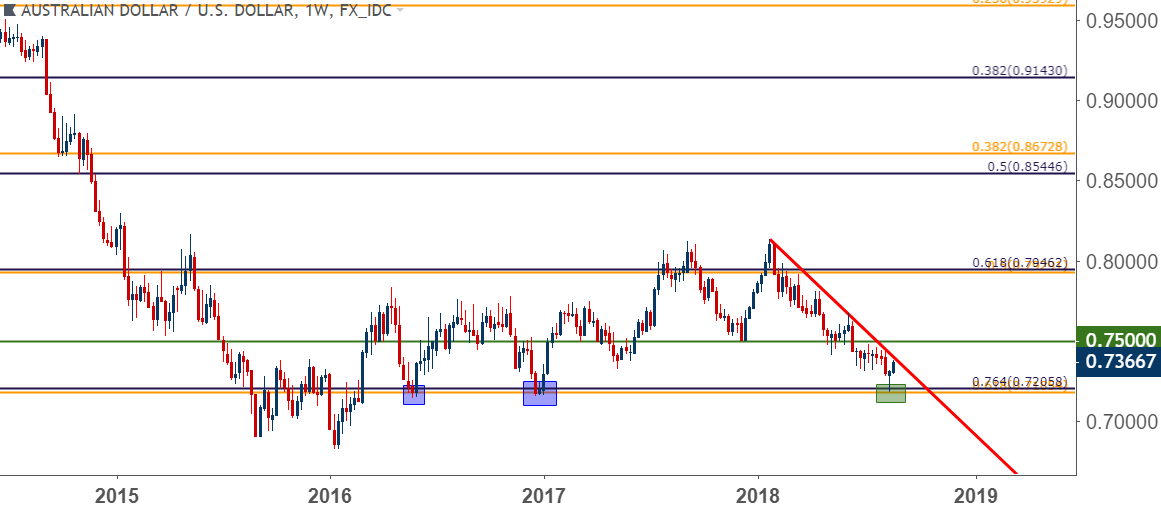
Chart prepared by James Stanley
USD/CAD Build into Wedge
USD/CAD is building into a symmetrical wedge pattern on the Daily chart, leaving traders with two potential routes: Either trade within the digestion or to try plot for and trade a break. For those looking to trade within the digestion, confluent support around the 1.3000 handle can help to make topside plays look a bit more attractive.
USD/CAD Daily Price Chart: Digesting into Symmetrical Wedge
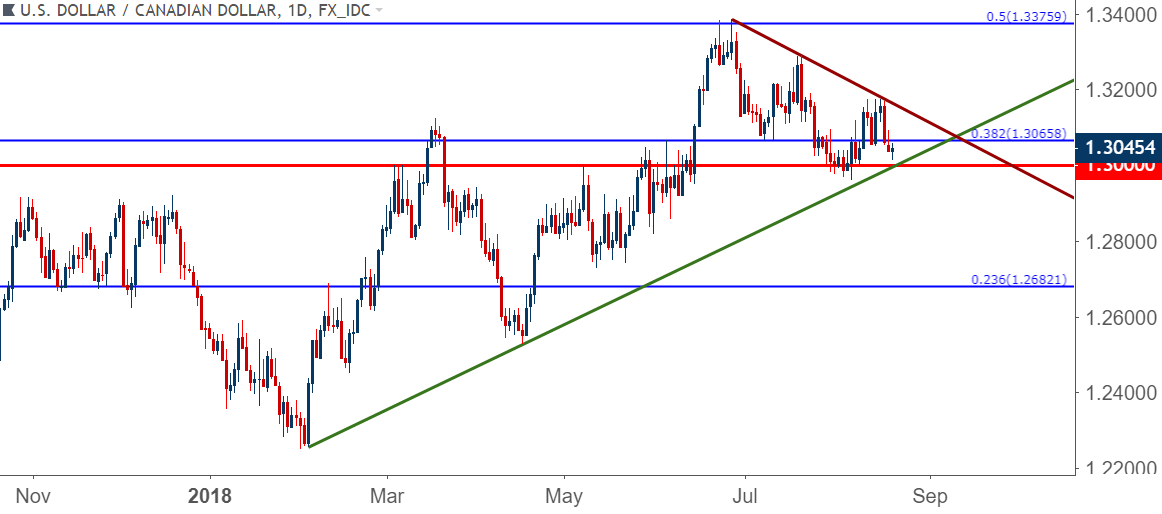
Chart prepared by James Stanley
USD/JPY Gets Messy
Yen strength has been on the way back of recent, and we looked at this in a few different setups so far this month. We previously looked at short-term bearish setups in GBP/JPY. And in this week’s FX Setups, we looked at short-side plays for EUR/JPY. Each of these could be a bit more attractive to seek-out JPY strength, as buying JPY against a really weak US Dollar could produce challenges, particularly if USD-strength perks back up.
EUR/JPY Nearing Secondary Resistance Zone
We looked at two different areas of possible resistance in EUR/JPY coming into this week. The first of which was taken from a group of prior swing lows around 127.50, and that’s been soundly broken with today’s strong topside push. The second of those zones, however, exists around the same Fibonacci level that opened the door for bearish breakouts earlier in the month. This is the 38.2% retracement of the ‘Abenomics’ move in the pair that runs from the 2012 lows up to the 2014 highs.
Resistance showing here re-opens the door for short-side plays.
EUR/JPY Four-Hour Price Chart
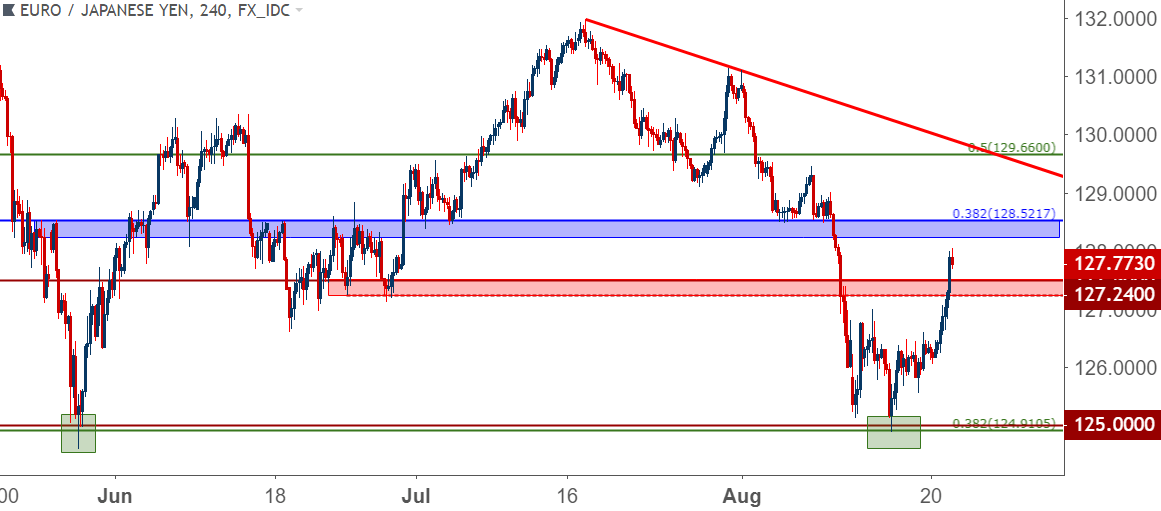
Chart prepared by James Stanley
To read more:
Are you looking for longer-term analysis on the U.S. Dollar? Our DailyFX Forecasts for Q1 have a section for each major currency, and we also offer a plethora of resources on USD-pairs such as EUR/USD, GBP/USD, USD/JPY, AUD/USD. Traders can also stay up with near-term positioning via our IG Client Sentiment Indicator.
Forex Trading Resources
DailyFX offers a plethora of tools, indicators and resources to help traders. For those looking for trading ideas, our IG Client Sentiment shows the positioning of retail traders with actual live trades and positions. Our trading guides bring our DailyFX Quarterly Forecasts and our Top Trading Opportunities; and our real-time news feed has intra-day interactions from the DailyFX team. And if you’re looking for real-time analysis, our DailyFX Webinars offer numerous sessions each week in which you can see how and why we’re looking at what we’re looking at.
If you’re looking for educational information, our New to FX guide is there to help new(er) traders while our Traits of Successful Traders research is built to help sharpen the skill set by focusing on risk and trade management.
--- Written by James Stanley, Strategist for DailyFX.com
Contact and follow James on Twitter: @JStanleyFX


