


Our Elliott Wave analysis is suggesting a round of partial USD weakness coming. USDJPY, EURUSD, and gold charts all point to patterns suggesting a weakening US Dollar.
The video above is a recording of a US Opening Bell webinar from May 21, 2018.
Elliott Wave Theory Applied to USDJPY shows a correction looming
USDJPY has been on a mission to the upside lately. Through the lens of Elliott Wave Theory, we are seeing a mature trend in the short-term that is due to correct lower.
The impulse wave that began March 23 appears to be nearly complete. We can count the minimum fives waves up and the divergence on the RSI oscillator helps confirm the a mature impulse wave. Once USD/JPY reverses lower, we are anticipating a correction that could drive down towards 107.25-108.80.
We do believe this correction will be a partial retracement of the March 23 up trend and hold above 104.63

Elliott Wave Analysis for Gold
Gold prices finally pushed through and flushed out the $1302 price level last week. Our Elliott Wave analysis shows the gold chart may have finished a sideways Elliott Wave flat pattern [labeled as wave ((b))] and may embark upon a bullish wave ((c)) very soon.
In addition to smaller degree wave relationships for the dip appearing near $1286, the 61.8% Fibonacci retracement level of the December 2017 to January 2018 uptrend crosses near $1286 as well. As a result of a mature wave pattern and multiple wave relationship forming nearby, traders need to be on alert for a significant market rally coming through the gold chart in the near future.
If this scenario holds, wave ((c)) may rally above $1365 and possibly as high as $1408.

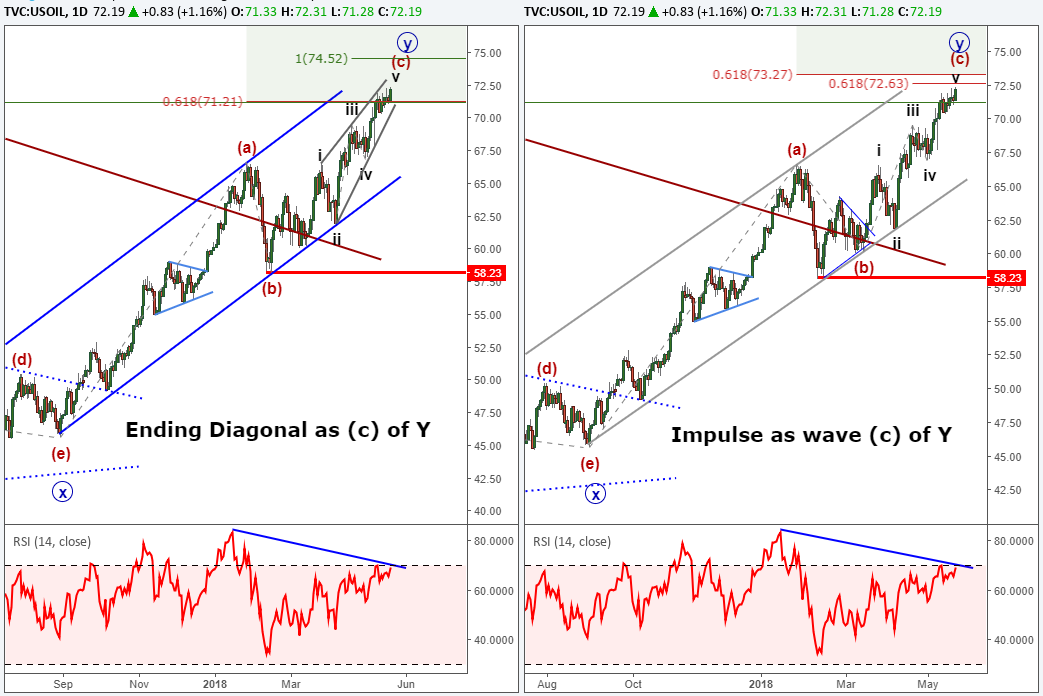
Crude Oil Hangs out with Several Wave Relationships in $71-$74
Crude oil prices continue to hang near recent highs. The longer-term crude oil price patterns nears a terminal point with some wave relationships in the $71-74. The price action since then has not altered our top views in that a reversal in trend may be near.
Should this reversal in crude oil price take hold, then we may see a deep correction in the latter part of calendar year 2018.
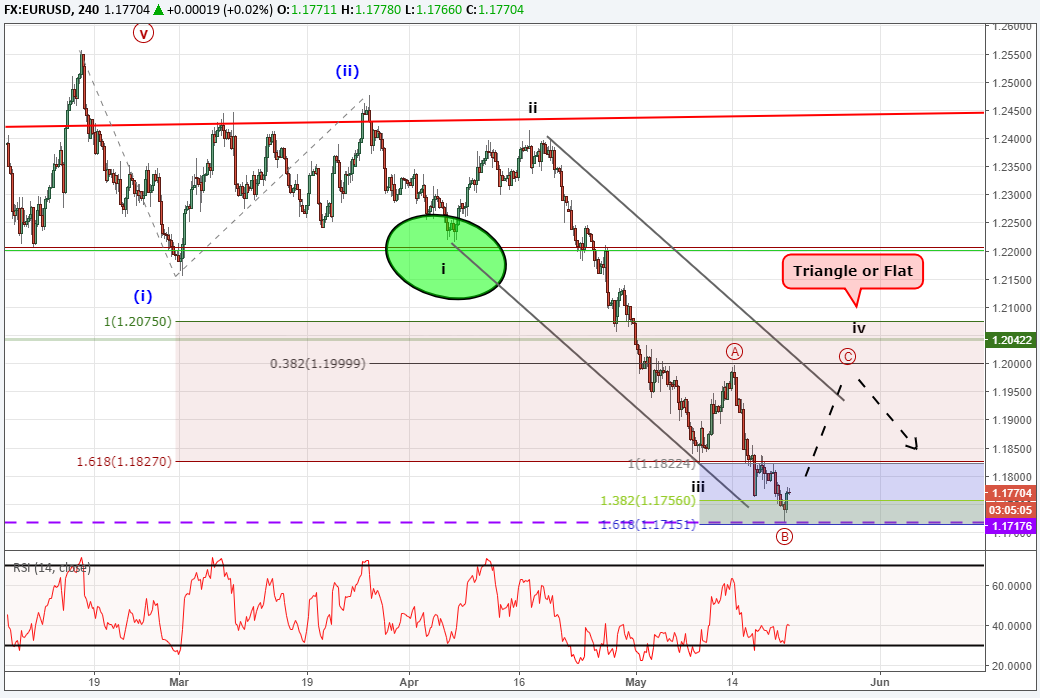
EURUSD Elliott Wave Chart Hints at a small relief rally
The dip in EURUSD down to 1.1717 on Monday has reached a meaningful level that may lead to a relief rally. The overall trend remains down, but we are anticipating a bounce back to 1.1950-1.2050.
The Elliott Wave chart we are analyzing places EUR/USD in a fourth wave expanded flat or fourth wave running triangle. Under both scenarios, a multiple hundred-pip rally would be considered normal for this fourth wave.
We need only to be concerned about the downtrend should EURUSD press up to 1.2150 or higher.
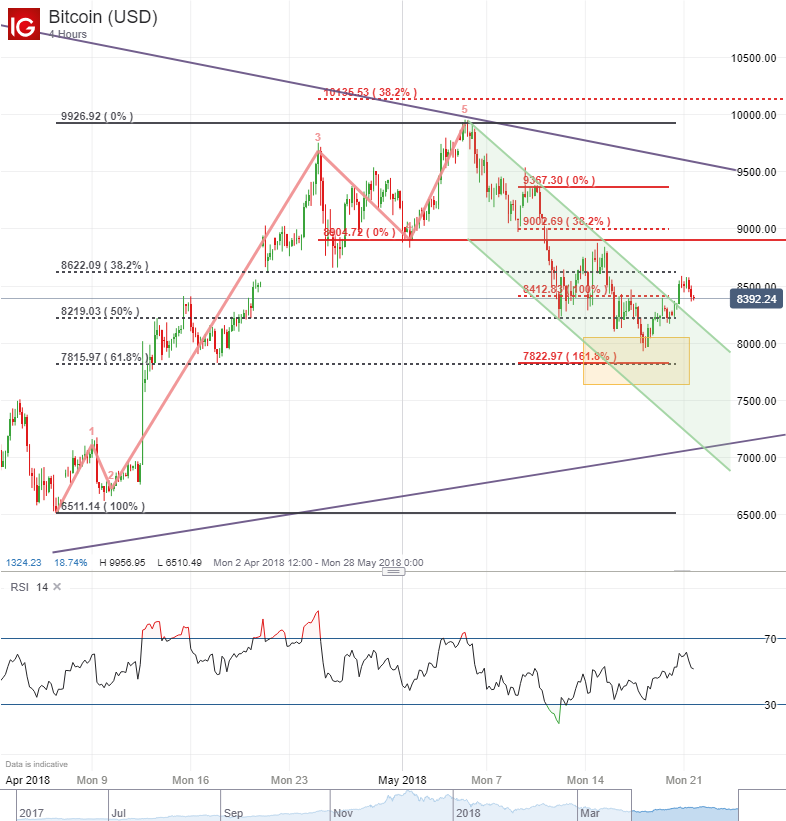
Bitcoin Elliott Wave Forecast Favors the Bulls
Last week, we wrote how the Bitcoin Elliott Wave forecast was for near term support of prices above 7,800.
The Elliott Wave model we are following for this cryptocurrency is a partial retracement of the April 6 to May 4 up trend. Bitcoin prices have dipped to the 61.8% Fibonacci retracement level of the prior up trend. That is a common area pivot area for corrections.
The Bitcoin price forecast is for prices to increase higher above 11,000.
Elliott Wave Theory FAQs
What are Elliott Wave impulse waves?
According to Elliott Wave Theory, the market moves five waves in the direction of the near term trend followed by a three wave counter trend wave. An impulse wave is one of two types of motive waves that denotes trend direction. Therefore, if we see a bearish impulse waveform, then after a three-wave counter trend wave, we can anticipate at least one more bearish motive wave.
If you are seeking further study into Elliott Wave Theory, read about our expert tips in our beginners and advanced trading guides.
After reviewing the guides above, be sure to follow future Elliott Wave articles to see Elliott Wave Theory in action.
What is the biggest mistake traders make?
Regardless of the style of analysis, many traders do lose money because they do not take the time to study the market and the effect of leverage. At DailyFX, we have studied millions of live trades and boiled our study down into a Traits of Successful Traders guide. You will find how leverage and human nature affects our trading so you can be better prepared for the next correction.
Elliott Wave Theory can be applied to a variety of highly liquid markets. FX is one of my favorite markets to apply the Elliott Wave principle. Learn more about trading FX with this guide specifically designed for you.
You might also be interested in…
* 3 things I wish I knew when I started trading forex
* What is the impulse wave pattern and how do you trade it?
* EURGBP Elliott Wave Chart Hints at Losses Towards 86 Cents
---Written by Jeremy Wagner, CEWA-M
Jeremy Wagner is a Certified Elliott Wave Analyst with a Master’s designation. Jeremy provides Elliott Wave analysis on key markets as well as Elliott Wave educational resources. Read more of Jeremy’s Elliott Wave reports via his bio page.
Communicate with Jeremy and have your shout below by posting in the comments area. Feel free to include your Elliott Wave count as well.
Discuss these markets with Jeremy in Monday’s US Opening Bell webinar.
Follow me on Twitter at @JWagnerFXTrader .


