


The US Dollar Index (DXY) is nearing the apex of a triangle, breakout on the horizon. GBP/USD strong pullback to support looking attractive for dip-buyers. We also looked at a few other charts of interest, EURJPY one of them.
Technical Highlights:
- US Dollar Index (DXY) triangle nearing apex
- GBP/USD hard drop has support test underway
- EUR/JPY chart pattern(s) piquing interest
For in-depth fundamental and technical analysis for your favorite market or currency, check out the newly released DailyFX Q2 Forecasts.
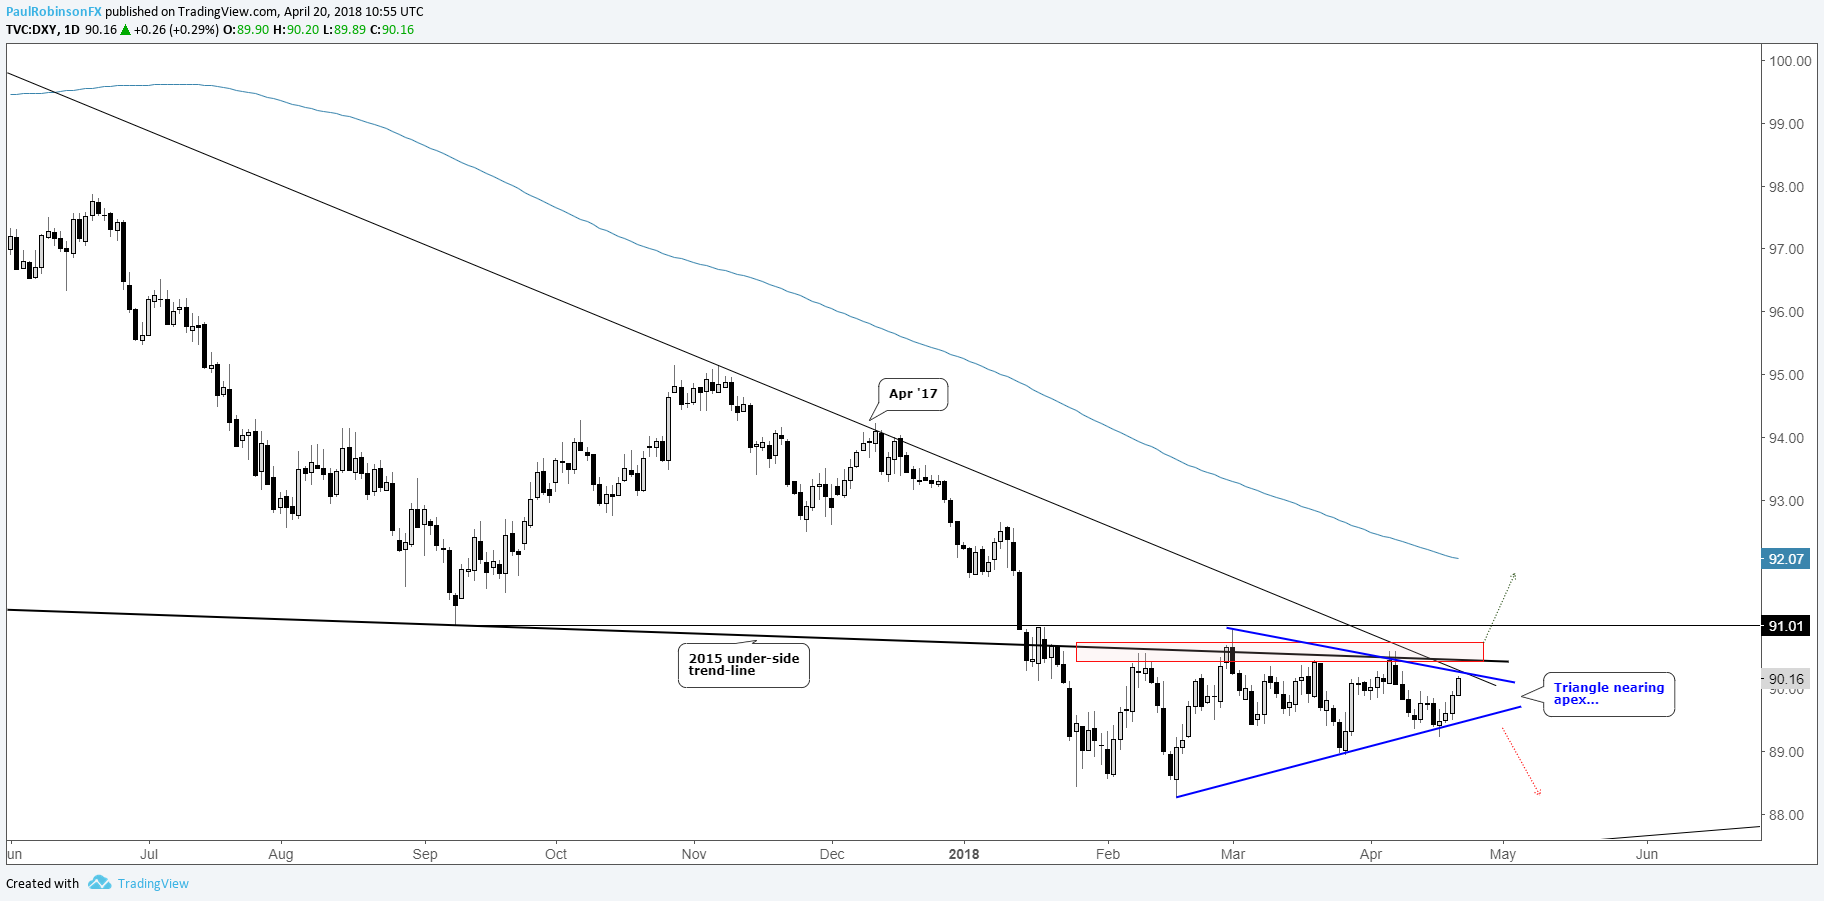
US Dollar Index (DXY) triangle nearing apex
Lately, it’s been feeling a little repetitive when discussing the US dollar as the range its been stuck in for the past three months persists. However, the range has been contracting which while in the short-term makes trading difficult, there is reason to be optimistic we are on the verge of an extended move.
The triangle dating back to February is quickly closing in on its apex and is set to break out in the next 1-2 weeks. As it currently stands within the context of a broader downtrend it looks most probable to resolve to the downside, however; the nature of the pattern is such that the contraction in volatility only portends an expansion in price and doesn’t provide a concrete directional bias.
With that said, we’ll wait for the pattern to break and run with it. On a break of the lower trend-line the 2011 trend-line will be targeted in the mid-87s. On the top-side, a breakout will require a move above the 2015 underside trend-line and April 2017 trend-line before garnering momentum. In either event, things look set to heat up soon…
US Dollar Index (DXY) Daily Chart (Triangle)
For the intermediate-term fundamental/technical outlook, check out the Q2 Forecast for USD
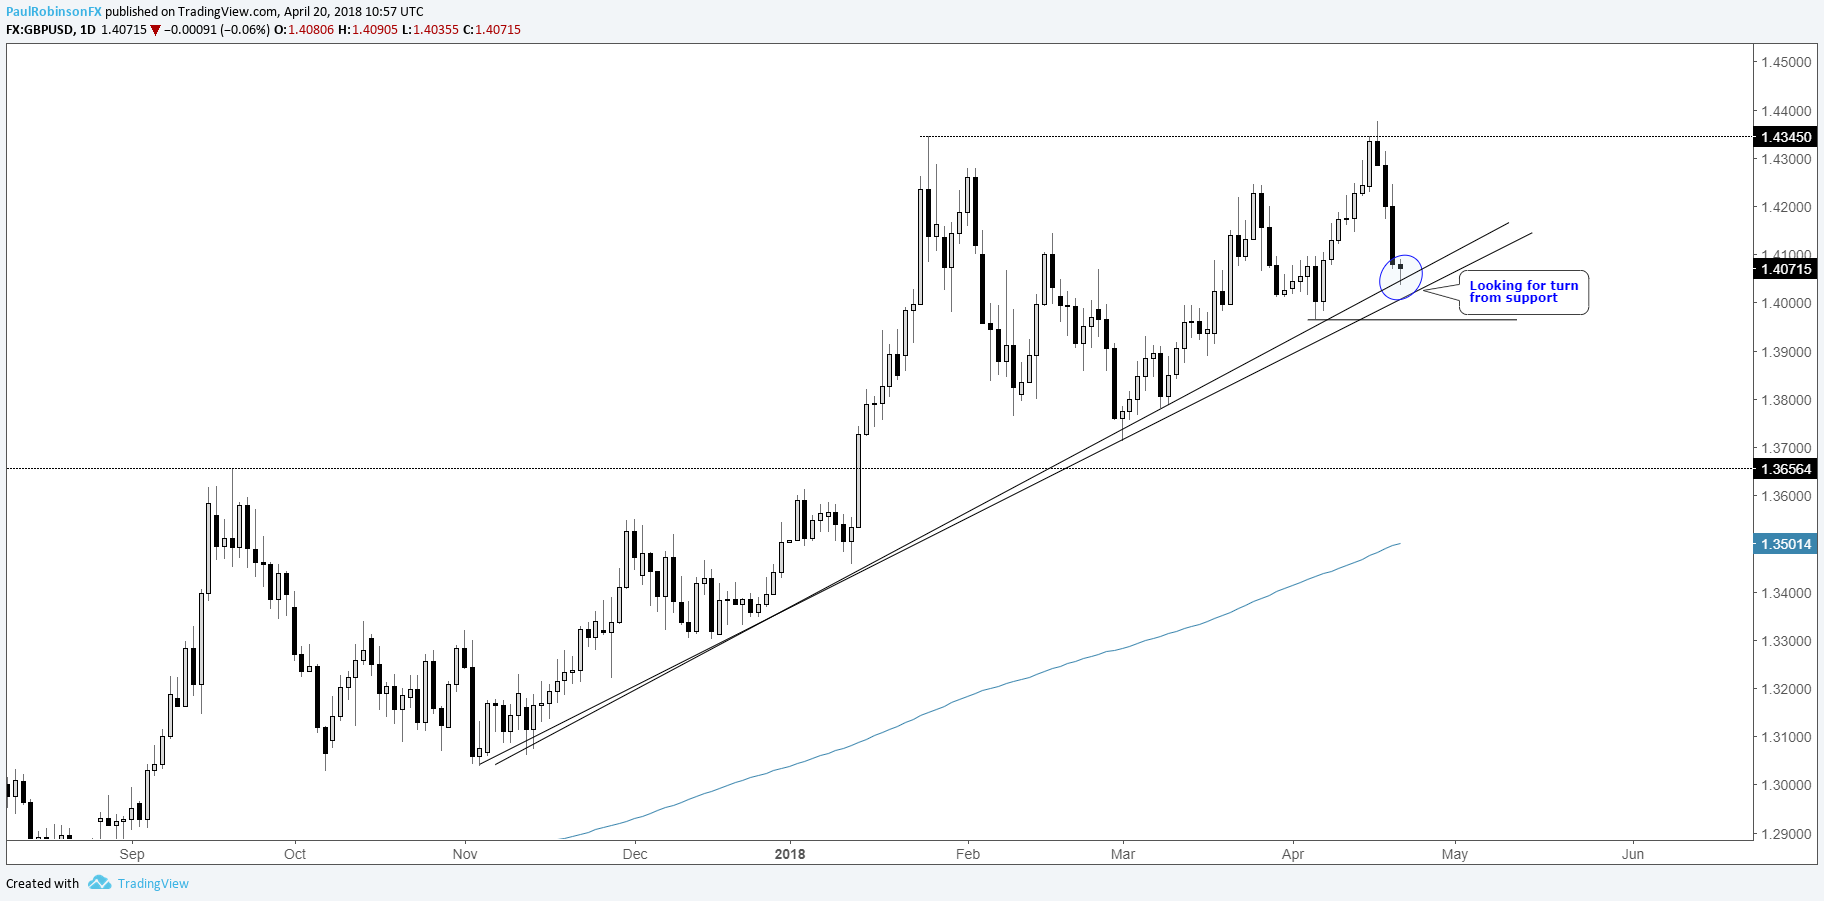
GBP/USD hard drop has support test underway
The broader trend in cable is to the top-side, marked by higher-highs and higher-lows. With that said, the drop this week is bringing into play trend-line support and a possible buy-the-dip opportunity. The strong drop likely has many would-be longs shy at the moment, but keep in mind that is the nature this particular pair.
However, before looking for a turn back higher we would like to see momentum curl back to the top-side first (It’s trying to do just that at the time of this writing). A decline below 13965 would significantly undercut a bullish outlook.
GBP/USD Daily Chart (Testing Support)
For the intermediate-term fundamental/technical outlook, check out the Q2 Forecast for GBP
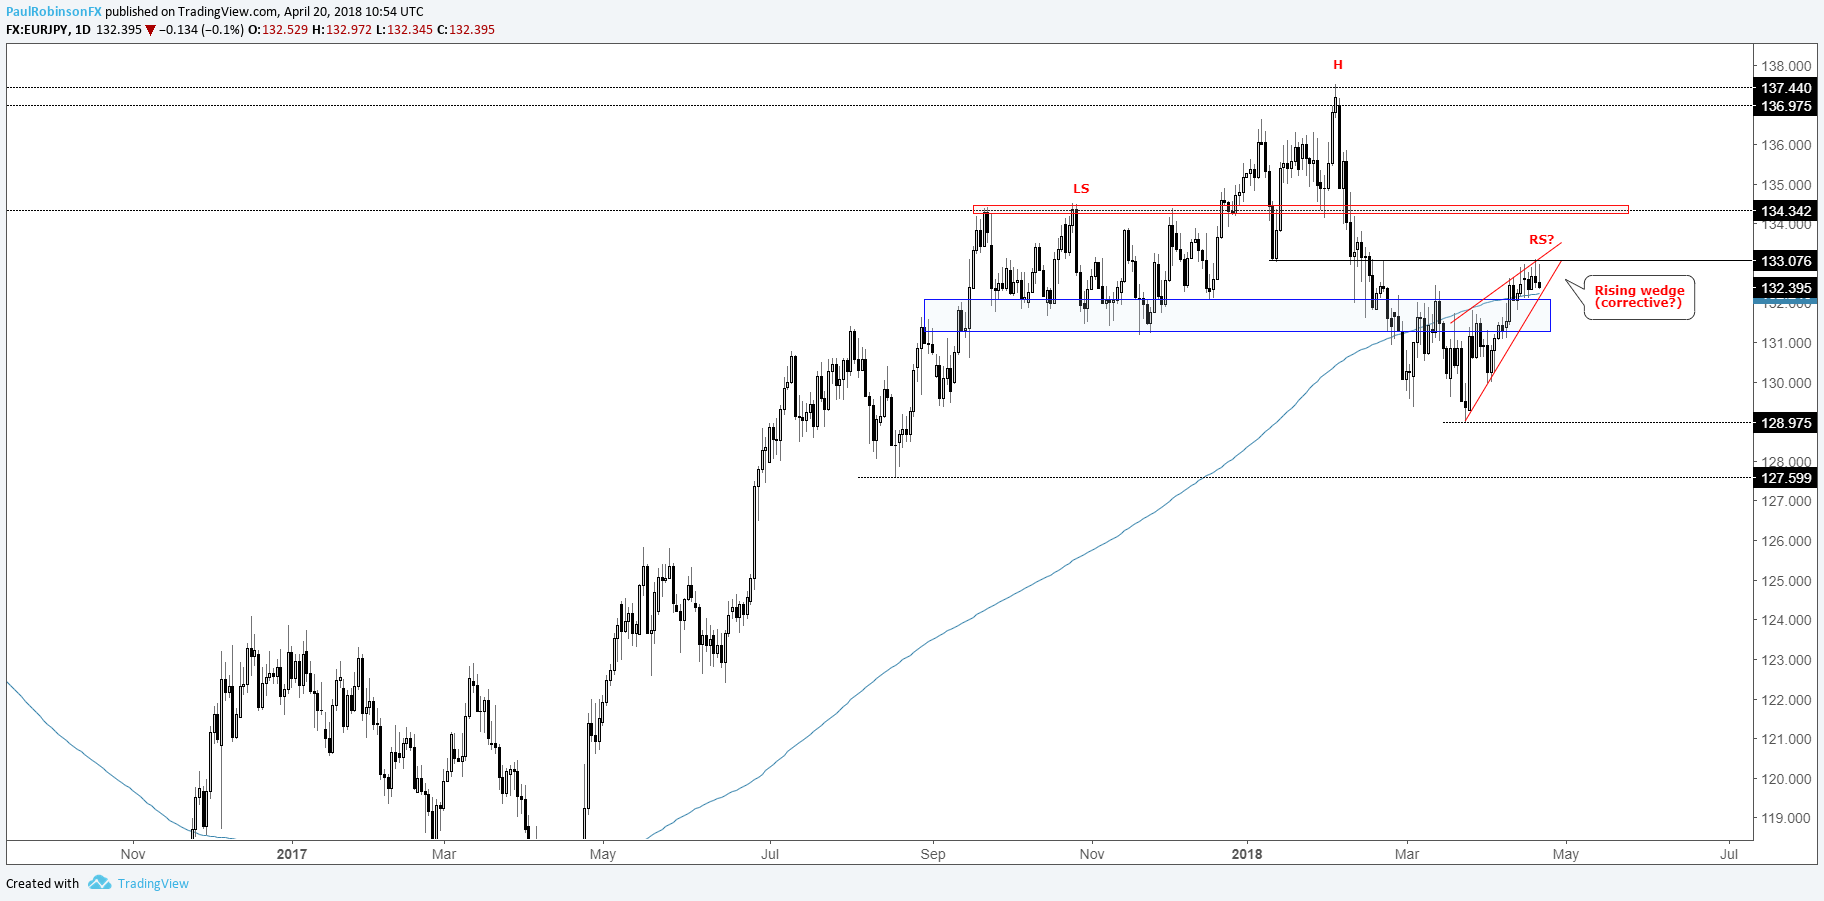
EUR/JPY chart pattern(s) piquing interest
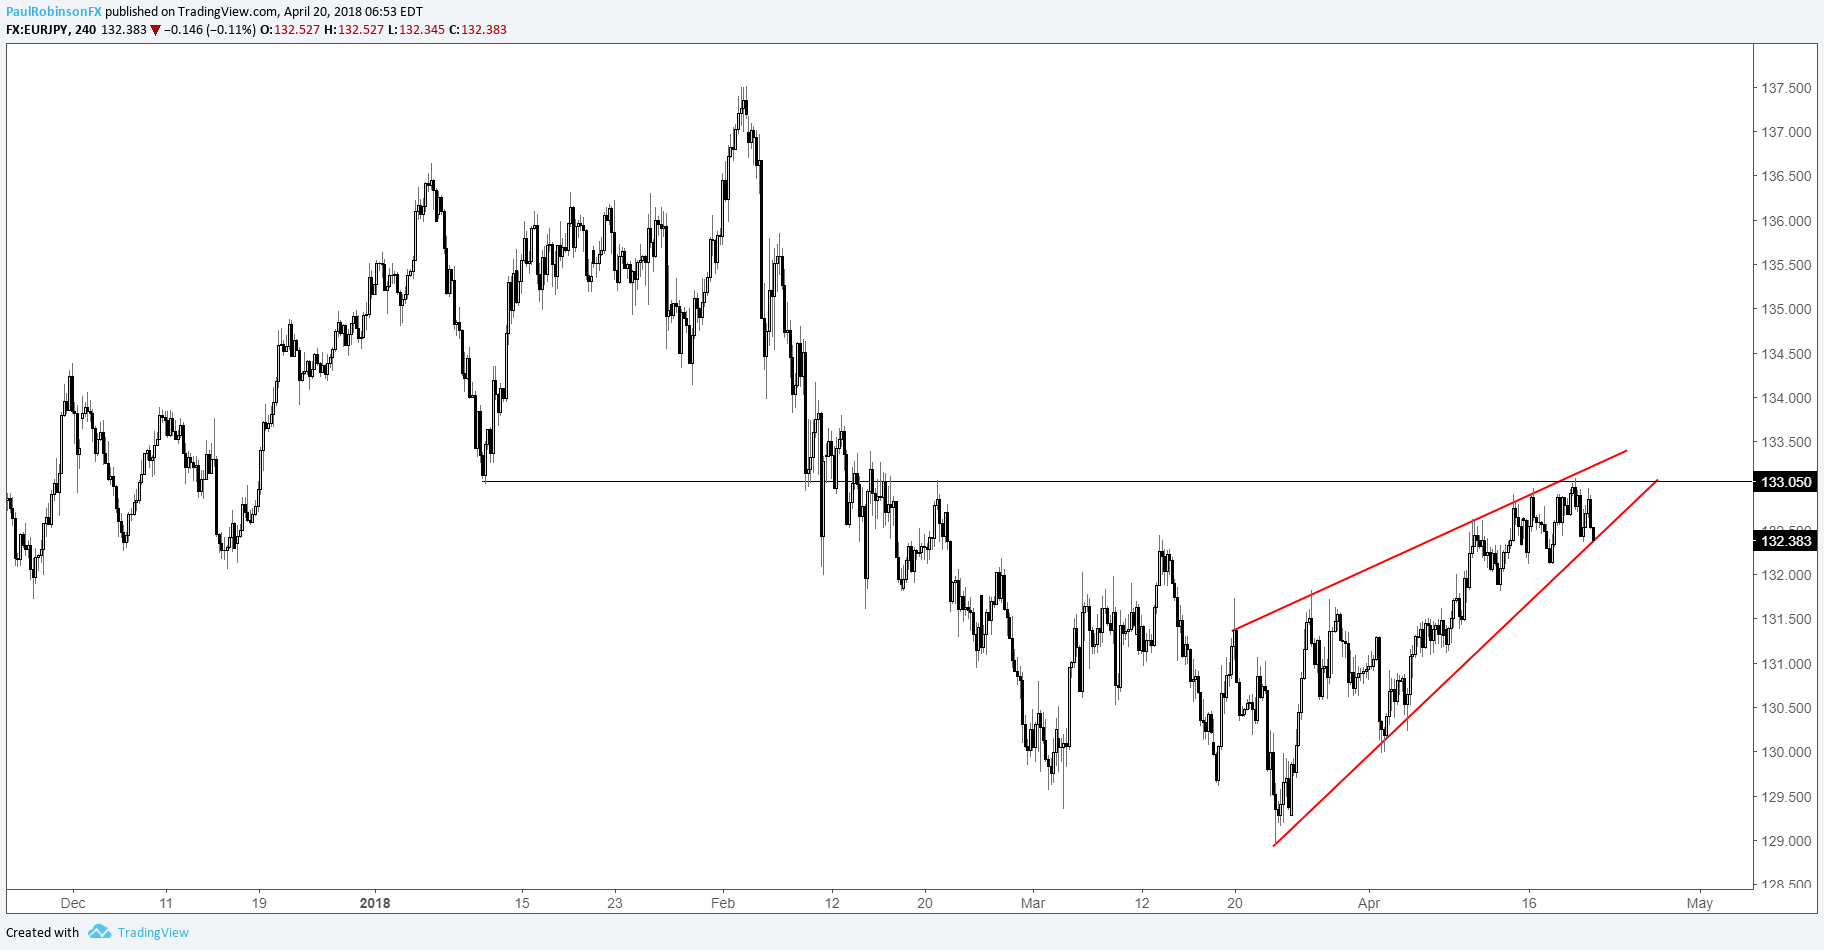
EUR/JPY is beginning to have some appeal from both a chart pattern perspective both in the near-term as well as longer-term. In the near-term, a rising wedge is shaping up, but a break down out of the pattern and below support down to ~13130 will be needed to strengthen a bearish view.
Looking longer-term, if we see a strong turn lower a right shoulder of a head-and-shoulders pattern dating back to September could quickly cement a broader top for the cross-rate. It’s not the most symmetrical pattern, but is fairly visible. For now, we’ll see if the ascending wedge scenario works out and provide an update later on the broader scenario.
EUR/JPY Daily Chart (H&S, Wedge)
For the intermediate-term fundamental/technical outlook, check out theQ2 Forecast for EUR & JPY
EUR/JPY 4-hr Chart (Rising Wedge)
We also looked at USD/JPY, AUD/USD, NZD/USD, GBP/JPY, CHF/JPY, AUD/JPY, NZD/JPY, GBP/NZD, AUD/NZD, gold, S&P 500, DAX, along with a few others markets/pairs.
Resources for Forex & CFD Traders
Whether you are a new or an experienced trader, DailyFX has several resources available to help you; indicator for tracking trader sentiment, quarterly trading forecasts, analytical and educational webinars held daily, trading guides to help you improve trading performance, and one specifically for those who are new to forex.
---Written by Paul Robinson, Market Analyst
To receive Paul’s analysis directly via email – SIGN UP HERE
You can follow Paul on Twitter at @PaulRobinsonFX


