


Gold Technical Price Forecast: XAU/USD Weekly Trade Levels
- Gold price updated trade levels - Weekly Technical Chart
- XAU/USD rally attempting third weekly advance– rebound approaching downtrend resistance
- Get started with this Free How to Trade Gold -Beginners Guide s
Gold prices have rallied more than 6.3% off the yearly lows with XAU/USD attempting to mark a third consecutive weekly advance. A recovery off trend support is now approaching technical downtrend resistance and we’re looking for a reaction just higher for guidance early in the month.These are the updated targets and invalidation levels that matter on the XAU/USD weekly technical price chart heading into August. Review my latest Weekly Strategy Webinar for an in-depth breakdown of this gold technical setup and more.
Gold Price Chart - XAU/USD Weekly

Chart Prepared by Michael Boutros, Technical Strategist; Gold on Tradingview
Notes: In last month’s Gold Weekly PriceOutlook we noted that XAU/USD had, “plunged through major uptrend support and remains vulnerable to further declines while below the 2018 / 2019 trendline. From at trading standpoint, look to reduce short-exposure / lower protective stops on a stretch towards 1671/82– rallies / recoveries should be capped by 1791 IF price is heading lower on this stretch.” Gold registered a low at 1680 the following week before rebounding sharply with the rally now approaching the January low-week close at 1791- we looking for possible price inflection into this threshold IF reached.
Key resistance / bearish invalidation rests just higher at the confluence of the 100% extension, the 61.8% Fibonacci retracement and the 52-week moving average 1818/28. A breach / weekly close above this threshodl would be needed to suggest a more significant low was registered last month / a larger turn may be underway. Initial weekly support now back at the 2021 / 2022 low-week closes at 1727/29 with key support steady at 1671/82- note that weakness beyond this threshold could see fuel another accelerated decline in gold with such a scenario exposing the 2020 March reversal close at 1631.

Bottom line: Gold has rebounded off downtrend support and we’re looking for a reaction / possible inflection on a stretch towards yearly downtrend resistance / 1818/28. From a trading standpoint, a good region to reduce portions of long-exposure / raise protective stops – losses should be limited by 1727 IF price is indeed heading higher. Stay nimble into the close of the week with US Non-Farm Payrolls on Friday likely to charge some volatility here. Review my latest Gold Price Outlook for a closer look at the near-term XAU/USD technical trade levels.
For a complete breakdown of Michael’s trading strategy, review his Foundations of Technical Analysis series on Building a Trading Strategy
Gold Trader Sentiment – XAU/USD Price Chart
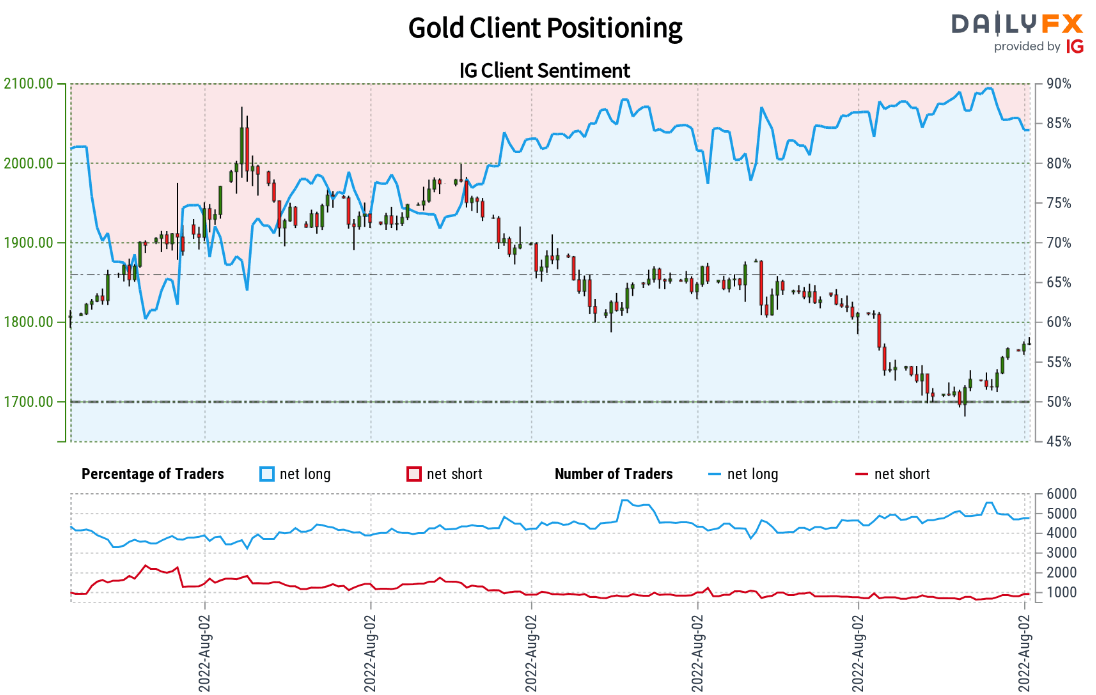
- A summary of IG Client Sentiment shows traders are net-long Gold- the ratio stands at +5.45 (84.49% of traders are long) – typically bearishreading
- Long positions are2.28% higher than yesterday and 13.59% lower from last week
- Short positions are 2.79% lower than yesterday and 24.57% higher from last week
- We typically take a contrarian view to crowd sentiment, and the fact traders are net-long suggests Gold prices may continue to fall. Traders are more net-long than yesterday but less net-long from last week. The combination of current positioning and recent changes gives us a further mixed Gold trading bias from a sentiment standpoint.
| Change in | Longs | Shorts | OI |
| Daily | 1% | -3% | -1% |
| Weekly | 2% | -8% | -2% |
Active Weekly Technical Charts
- Silver (XAG/USD)
- Crude Oil (WTI)
- Australian Dollar (AUD/USD)
- British Pound (GBP/USD)
- US Dollar Index (DXY)
- Canadian Dollar (USD/CAD)
- Euro (EUR/USD)
- S&P 500, Nasdaq, Dow
- Written by Michael Boutros, Technical Strategist with DailyFX
Follow Michael on Twitter @MBForex


