


Gold Technical Price Outlook: XAU/USD Short-term Trade Levels
- Gold price updated technical trade levels – Daily & Intraday Charts
- XAU/USD threatens outside-day reversal off downtrend support- threat for larger recovery
- New to Gold Trading? Get started with this Free How to Trade Gold -Beginners Guide
Gold prices have rebounded off key technical support with the recovery now in focus heading into major event risk this week. While the broader outlook stays weighted to the downside, the threat for a larger rebound remains while above 1696 – the stage is set heading into the Fed interest rated and key growth & inflation data into the close of the month. These are the updated targets and invalidation levels that matter on the XAU/USD technical charts heading into the FOMC and the close of the week / month. Review my latest Strategy Webinar for an in-depth breakdown of this gold technical setup and more.
Gold Price Chart - XAU/USD Daily
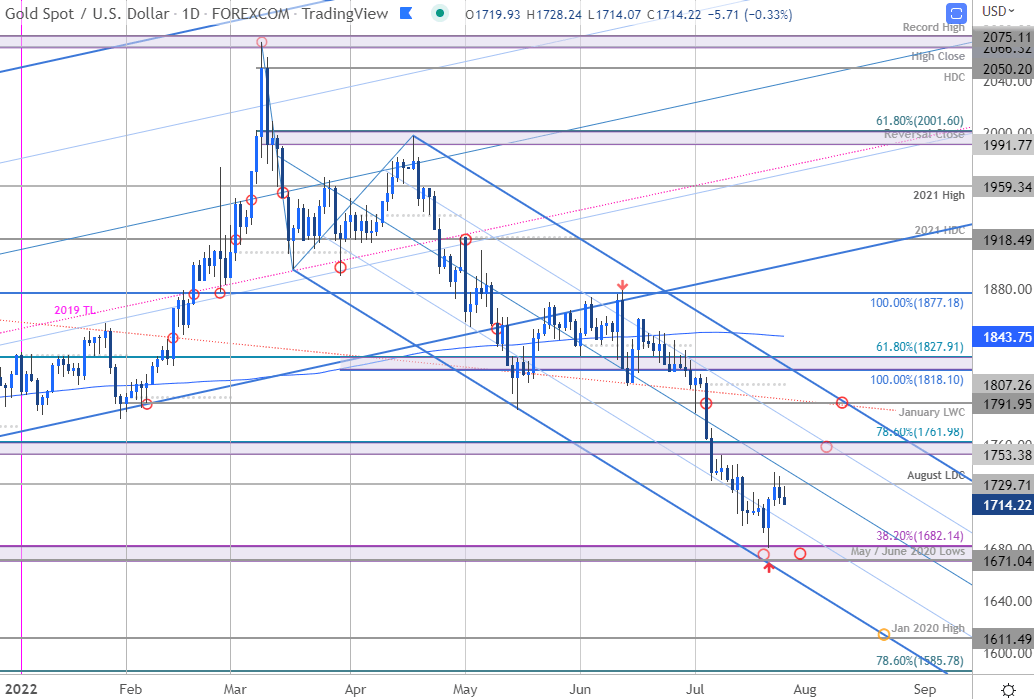
Chart Prepared by Michael Boutros, Technical Strategist; Gold on Tradingview
Technical Outlook: In my last Gold Price Outlook we noted that XAU/USD had, “responded to downtrend support with a daily reversal candle that nearly covers the entire weekly range – the immediate short-bias is vulnerable here.” This interpretation was invalidated the following day when gold plunged even lower with price rebounding sharply with an outside-day reversal off a key support barrier at 1671/82- a region defined by the May / June 2020 lows, the 2021 lows and the 38.2% Fibonacci retracement of the 2015 advance. A rebound of more than 3.4% is now holding just below the August low-day close at 1729 – the battle lines are drawn heading into the FOMC, US GDP and inflation (PCE) later this week.
Gold Price Chart - XAU/USD 240min

Notes: A closer look at Gold price action highlights last week’s rebound off key support with the recovery faltering just ahead of the median-line into the weekly open. Initial resistance now eyed at the December low / 78.6% retracement of the 2021 range at 1753/62 with medium-term bearish invalidation now lowered to the January low-day/week close at 1791- a breach / close above this threshold would be needed to suggest a more significant low was registered this month. Note that a break below this key support barrier could fuel another bout of accelerated losses for the yellow metal with such a scenario exposing subsequent objectives at the lower parallel (currently ~1650s) and the January 2020 swing high at 1611.

Bottom line: Gold prices have rebounded off confluent downtrend support with major event risk on tap into the close of the week / month. From at trading standpoint, look for downside exhaustion ahead of the yearly low-close at 1696 IF price is heading higher on this recovery with a breach above the weekly range highs needed to fuel the push. Expect volatility into the FOMC tomorrow and stay nimble into the monthly / weekly close. Review my latest Gold Weekly Price Outlook for a closer look at the longer-term XAU/USD technical trading levels.
For a complete breakdown of Michael’s trading strategy, review his Foundations of Technical Analysis series on Building a Trading Strategy
Gold Trader Sentiment – XAU/USD Price Chart
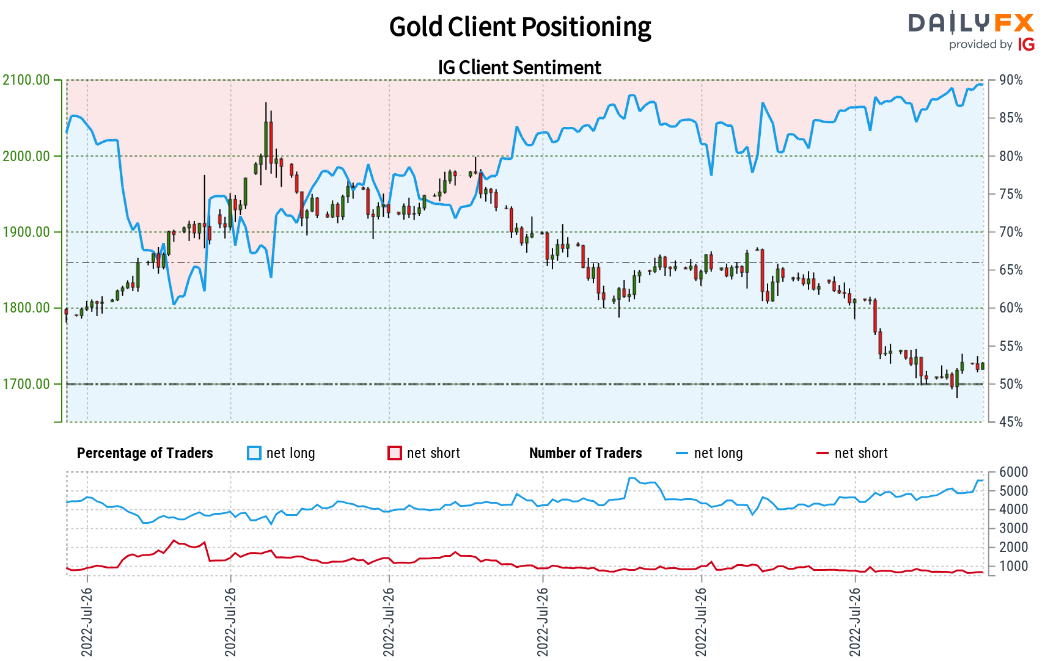
- A summary of IG Client Sentiment shows traders are net-long Gold- the ratio stands at +7.85 (88.70% of traders are long) – typically bearishreading
- Long positions are10.78% higher than yesterday and 11.34% higher from last week
- Short positions are2.64% lower than yesterday and 2.94% higher from last week
- We typically take a contrarian view to crowd sentiment, and the fact traders are net-long suggests Gold prices may continue to fall. Traders are further net-long than yesterday and last week, and the combination of current positioning and recent changes gives us a stronger Gold-bearish contrarian trading bias from a sentiment standpoint.
| Change in | Longs | Shorts | OI |
| Daily | 3% | -5% | -1% |
| Weekly | 12% | 3% | 7% |
Economic Calendar

Economic Calendar - latest economic developments and upcoming event risk.
Active Technical Setups
- Dow Jones Technical Forecast: DJI Rebound Faces Downtrend Resistance
- Canadian Dollar Price Outlook: USD/CAD Reversal Slams into Support
- Crude Oil Technical Outlook: WTI Spills into Last Lines of Support
- S&P 500 Forecast: Stocks Plunge, SPX Technical Support at July Lows
- EUR/USD Technical Outlook: Euro Drops to 20yr Low- Breakdown Levels
- Written by Michael Boutros, Technical Strategist with DailyFX
Follow Michael on Twitter @MBForex


