


Gold Technical Price Forecast: XAU/USD Weekly Trade Levels
- Gold price updated technical trade levels - Weekly Chart
- XAU/USD plunge targets broader uptrend support- risk for exhaustion low ahead of 1738
- New to Gold Trading? Get started with this Free How to Trade Gold -Beginners Guide
Gold prices are on the defensive for the second consecutive week with XAU/USD down more than 1% ahead of New York close on Wednesday. The decline is now approaching longer-term uptrend support and the focus is on a possible exhaustion-low in the weeks ahead. These are the updated targets and invalidation levels that matter on the XAU/USD weekly technical chart. Review my latest Weekly Strategy Webinar for an in-depth breakdown of this gold technical setup and more.
Gold Price Chart - XAU/USD Weekly

Chart Prepared by Michael Boutros, Technical Strategist; Gold on Tradingview
Notes: In my last Gold Weekly PriceOutlook we noted to be on the XAU/USD rally was, "approaching some major resistance objectives and while the broader focus does remain higher, we’re looking for possible inflection off one of these zones.” The first level of interest was around ~1805- a region defined by the 52-week moving average and the trendline off the late-May & 2020 swing lows (purple). Gold registered an intra-week high at 1813 before turning lower with price now off more 3% from the highs- we’re on the lookout for support.
Initial weekly support rests at the 61.8% Fibonacci retracement of the late-September rally at 1757 backed by the broader 61.8% retracement of the broader August rally at 1738- losses should be limited by this threshodl IF price is indeed heading higher. Initial weekly resistance remains with the 52-week moving average (currently ~1804) backed by the 61.8% retracement of the May decline at 1825 and the yearly high-week close at 1849- a topside breach / close above this threshold is needed to mark resumption of the broader uptrend in Gold.

Bottom line: A multi-month consolidation in Gold is taking shape just above broader uptrend support. From a trading standpoint, be on the lookout for downside exhaustion ahead of 1738 in the weeks ahead with a breach above 1849 ultimately needed to fuel the next leg higher towards 1900. Stay nimble into Friday’s US Non-Farm Payroll (NFP) report with the release likely to spur some volatility here. Review my latest Gold Price Outlook for a closer look at the near-term XAU/USD technical trade levels
.
For a complete breakdown of Michael’s trading strategy, review his Foundations of Technical Analysis series on Building a Trading Strategy
Gold Trader Sentiment – XAU/USD Price Chart

- A summary of IG Client Sentiment shows traders are net-long Gold- the ratio stands at +3.33 (76.92% of traders are long) – typically bearishreading
- Long positions are12.20% higher than yesterday and 3.61% higher from last week
- Short positions are 24.44% lower than yesterday and 10.78% higher from last week
- We typically take a contrarian view to crowd sentiment, and the fact traders are net-long suggests Gold prices may continue to fall. Traders are more net-long than yesterday but less net-long from last week. The combination of current positioning and recent changes gives us a further mixed Gold trading bias from a sentiment standpoint.
| Change in | Longs | Shorts | OI |
| Daily | 1% | -3% | -1% |
| Weekly | 2% | -8% | -2% |
---
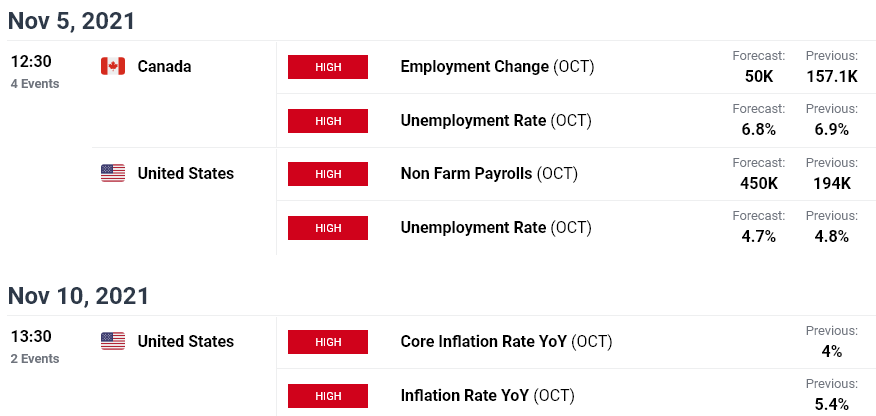
Key Data Releases – Economic Calendar
Previous Weekly Technical Charts
- Canadian Dollar (USD/CAD)
- Sterling (GBP/USD)
- Euro (EUR/USD)
- Japanese Yen (USD/JPY)
- Crude Oil (WTI)
- Australian Dollar (AUD/USD)
- US Dollar Index (DXY)
- Written by Michael Boutros, Currency Strategist with DailyFX
Follow Michael on Twitter @MBForex


