


Sterling Technical Price Outlook: GBP/USD Weekly Trade Levels
- Sterling technical trade level update – Weekly Chart
- GBP/USD in consolidation around yearly moving average- risk for deeper correction sub-1.40
- Focus is on a breakout of the 1.3670 – 1.3860 price range for guidance
The British Pound is attempting to mark a consecutive weekly doji against the US Dollar with GBP/USD continuing to straddle the 52-week moving average. The focus is on a breakout of this range in price as we head into the BoE and FOMC next week. These are the updated targets and invalidation levels that matter on the GBP/USD weekly chart. Review my latest Strategy Webinar for an in-depth breakdown of this Sterling technical setup and more.
Sterling Price Chart - GBP/USD Weekly

Chart Prepared by Michael Boutros, Technical Strategist; GBP/USD on Tradingview
Notes: In last month’s Sterling Weekly Price Outlook we noted that Cable was, “in consolidation just below multi-month downtrend resistance with GBP/USD carving a series of lower highs and higher lows just above multi-year uptrend support. From a trading standpoint, the focus is on a breakout of the monthly range for guidance with the broader outlook still weighted to the downside while within this formation.” Sterling broke lower the following week the price plummeting past the 2017 high-week close at 1.3494 to tag downtrend support at the lower parallel before a sharp recovery. The rally puts GBP/USD right back into the same range we were eyeing last month and once again- we’re on breakout watch.
Weekly support now rests at the highlighted median-line confluence near ~1.3670s – a break / close below this threshold is once again needed to shift the focus lower again with such a scenario exposing 1.3494 and critical support at 1.3245–1.3304- a region defined by the 61.8% Fibonacci retracement off the 2018 decline, the 2020 yearly open and the 100% extension of the June decline. Weekly resistance stands at the highlighted parallel confluence near ~1.3860s with a breach / close above critical resistance at 1.3631/97 needed to suggest a larger trend reversal is underway in the pound.
For a complete breakdown of Michael’s trading strategy, review his Foundations of Technical Analysis series on Building a Trading Strategy
Bottom Line: Sterling has rallied back in to the 52-week moving average around ~1.3750s with price straddling this threshold for the last two week. From a trading standpoint, we’re on the lookout for possible topside exhaustion closer to the upper parallels with the broader outlook still weighted to the downside while below the 2018 high-week close at 1.3997. Keep in mind we have US inflation on tap Friday with the FOMC and BoE interest rate decisions slated for next week. Review my latest Sterling Price Outlook for a closer look at the near-term GBP/USD technical trade levels.

Sterling Trader Sentiment - GBP/USD Price Chart

- A summary of IG Client Sentiment shows traders are net-long GBP/USD - the ratio stands at +1.03 (49.35% of traders are long) – typically neutral reading
- Long positions are 9.70% higher than yesterday and 0.14% higher from last week
- Short positions are4.56% lower than yesterday and 2.62% lower from last week
- We typically take a contrarian view to crowd sentiment, and the fact traders are net-short suggests GBP/USD prices may continue to rise. Yet traders are less net-short than yesterday and compared with last week. Recent changes in sentiment warn that the current GBP/USD price trend may soon reverse lower despite the fact traders remain net-short.
| Change in | Longs | Shorts | OI |
| Daily | 3% | -7% | -3% |
| Weekly | 4% | -10% | -5% |
---
UK / US Economic Calendar
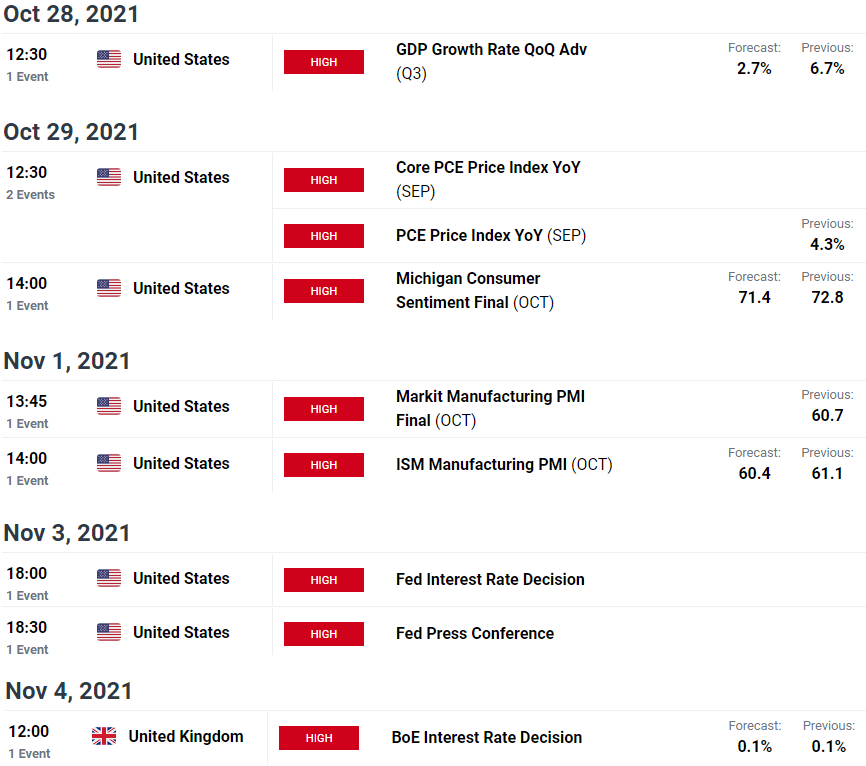
Economic Calendar - latest economic developments and upcoming event risk.
Previous Weekly Technical Charts
- Euro (EUR/USD)
- Gold (XAU/USD)
- Japanese Yen (USD/JPY)
- Crude Oil (WTI)
- Australian Dollar (AUD/USD)
- US Dollar Index (DXY)
- Canadian Dollar (USD/CAD)

--- Written by Michael Boutros, Technical Currency Strategist with DailyFX
Follow Michael on Twitter @MBForex


