


Crude Oil Technical Forecast: WTI Weekly Trade Levels
- Crude Oil updated technical trade levels – Weekly Chart
- WTI breakout marks eight weeks up- constructive above 74.94, resistance 82.84, 90.68 (key)
- New to Oil Trading? Get started with this Free How to Trade Oil-Beginners Guide
Oil prices are poised to snapped an eight-week winning streak with WTI down more than 1% on Wednesday in US trade. The breakout is testing initial resistance hurdles here and while the near-term may see some pullback, the broader outlook remains constructive in the weeks ahead while above a critical inflection zone in price. These are the updated targets and invalidation levels that matter on the oil price weekly chart. Review my latest Strategy Webinar for an in-depth breakdown of this crude oil price technical setup and more.
Crude Oil Price Chart – WTI Weekly
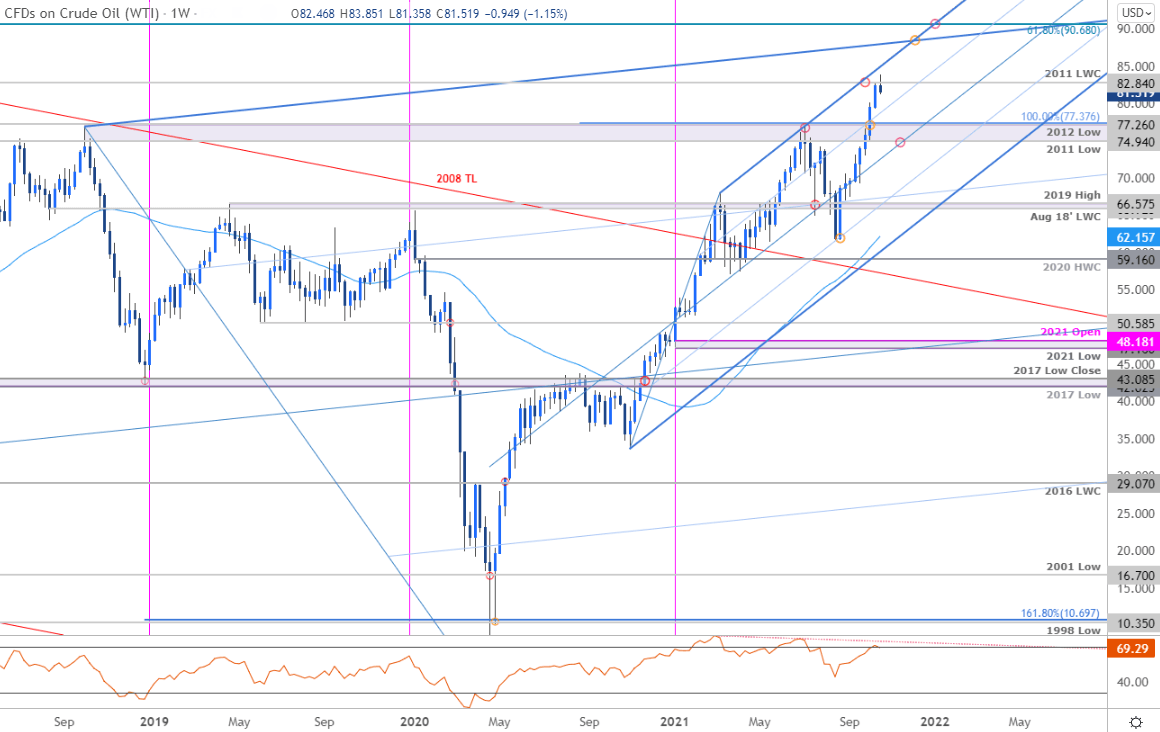
Chart Prepared by Michael Boutros, Technical Strategist; Crude Oil (WTI) on Tradingview
Notes: In my last Crude Oil Price Forecast we highlighted that a seven-week rally in WTI had broken above a critical resistance zone at the 2011 & 2012 lows / 100% extension at 74.94-77.37,while noting that a, “weekly close at these levels would keep the long-bias viable with subsequent resistance objectives eyed at the 2011 low-week close at 82.84 backed by the upper parallel of the multi-year pitchfork we’ve been tracking off the 2016 and 2020 lows (currently ~88), and the 61.8% Fibonacci retracement of the 2008 decline at 90.68- both levels of interest for possible topside exhaustion IF reached.”
The outlook remains unchanged with the rally extending into the first resistance target this week at 82.84. Initial weekly support now rests at the 25% parallel (currently ~79.10) backed by the median-line / 2011 low at 74.94- losses should be limited to this threshold IF price is heading higher.

Bottom line: The oil price breakout has extended into the first level of lateral resistance- risk for some ‘back and fill’ here but the outlook remains constructive. From at trading standpoint, pullbacks should be limited to the median-line with a close above 82.84 keeping the focus on subsequent resistance objectives towards the upper parallels. Review my latest Crude Oil Price Outlook for a closer look at the near-term WTI technical trade levels.
For a complete breakdown of Michael’s trading strategy, review his Foundations of Technical Analysis series on Building a Trading Strategy
Crude Oil Trader Sentiment – WTI Price Chart
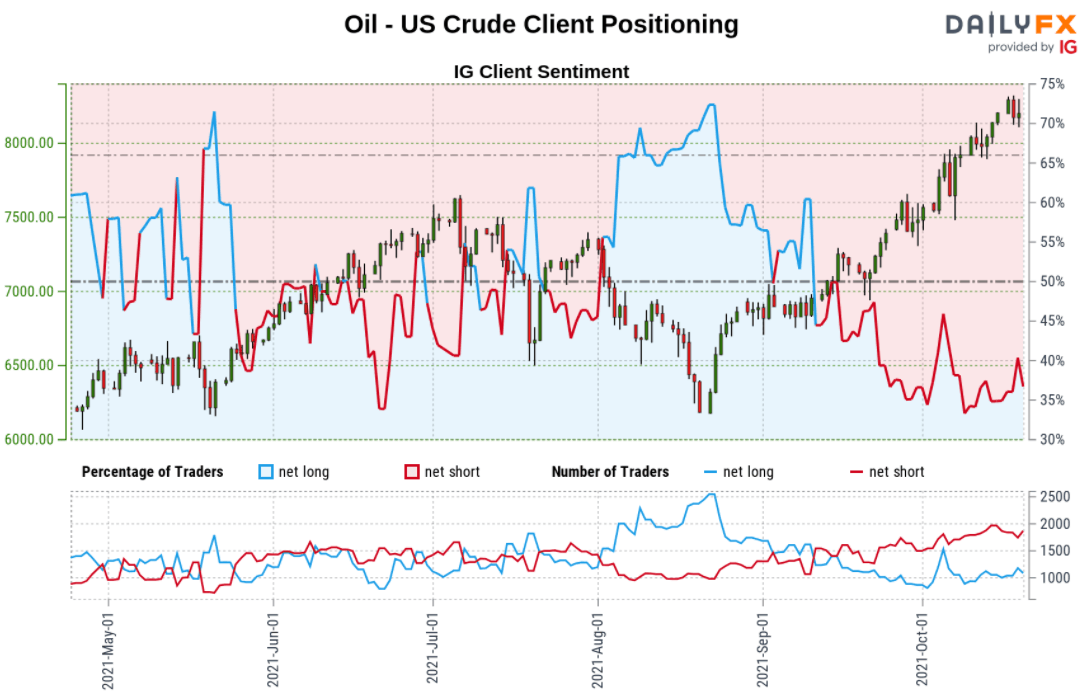
- A summary of IG Client Sentiment shows traders are net-short crude oil - the ratio stands at -1.62 (38.21% of traders are long) – typically bullish reading
- Long positions are8.87% lower than yesterday and 7.71% higher from last week
- Short positions are7.52% higher than yesterday and 6.75% higher from last week
- We typically take a contrarian view to crowd sentiment, and the fact traders are net-short suggests Oil - US Crude prices may continue to rise. Traders are more net-short than yesterday but less net-short from last week. The combination of current positioning and recent changes gives us a further mixed Oil - US Crude trading bias from a sentiment standpoint.
| Change in | Longs | Shorts | OI |
| Daily | 3% | -7% | 1% |
| Weekly | 31% | -38% | 7% |
---
Previous Weekly Technical Charts
- Australian Dollar (AUD/USD)
- Gold (XAU/USD)
- Japanese Yen (USD/JPY)
- US Dollar Index (DXY)
- Canadian Dollar (USD/CAD)
- Euro (EUR/USD)

--- Written by Michael Boutros, Technical Strategist with DailyFX
Follow Michael on Twitter @MBForex


