


- Gold price rejected at key technical resistance again– XAU/USD at risk sub-1522/26 in October
- Check out our 2019 projections in our Free DailyFX Gold Trading Forecasts
- Join Michael for Live Weekly Strategy Webinars on Mondays at 12:30GMT
Gold prices are were down this week with the precious metal off more than 1.4% to trade at 1494 ahead of the New York close on Friday. XAU/USD failed a fifth attempt to breach a critical resistance zone we’ve been tracking for months now and continues to highlight the near-term risk to gold prices heading into the start of October trade. These are the updated targets and invalidation levels that matter on the XAU/USD weekly charts. Review my latest Weekly Strategy Webinar for an in-depth breakdown of this gold price setup and more.
New to Gold Trading? Get started with this Free How to Trade Gold -Beginners Guide
Gold Price Chart - XAU/USD Weekly
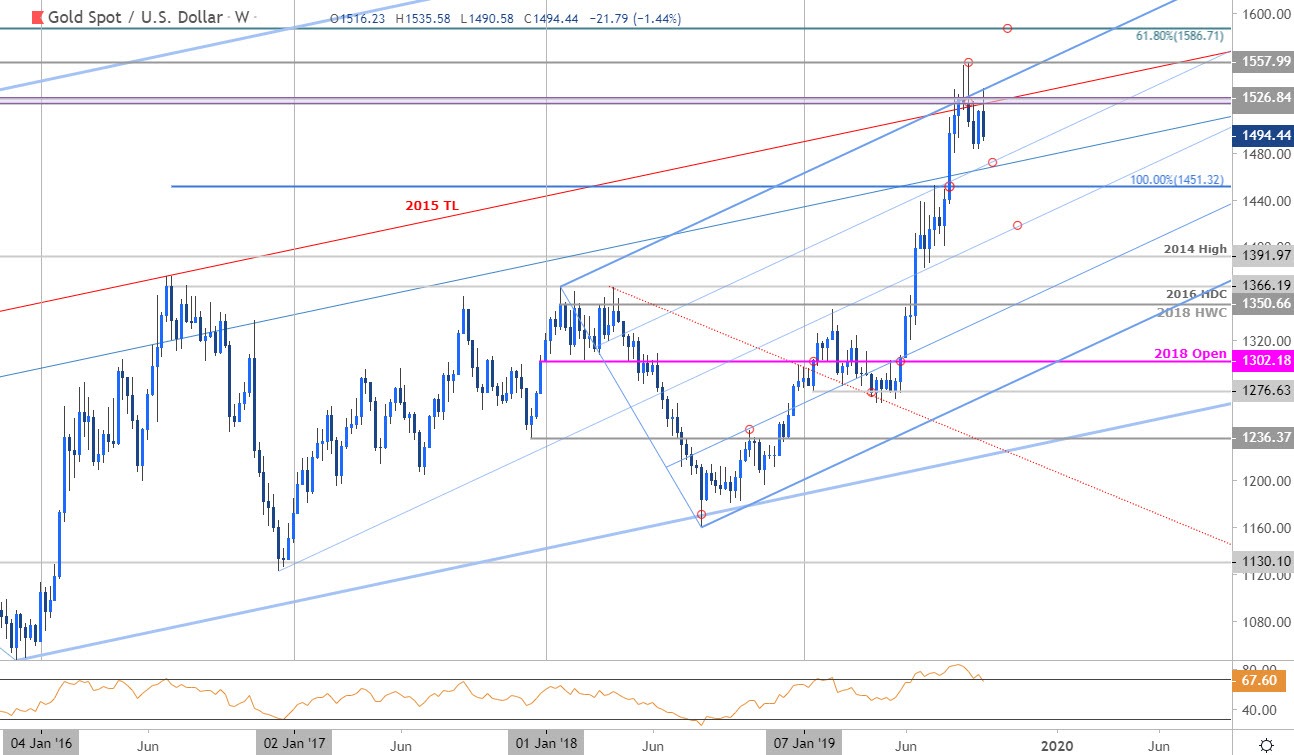
Chart Prepared by Michael Boutros, Technical Strategist; Gold on Tradingview
Notes: In my last Gold Price Weekly Outlook we noted that XAU/USD was in, “consolidation just below long-term trend resistance. From at trading standpoint, looking sideways to lower over the next few weeks with a larger decline to offer more favorable long-entries closer to trend support.” Price failed another attempt this week to breach a critical resistance barrier at 1522/26 where the late-2011 & 2012 swing lows converge on a pair of trendlines.
The risk remains for a deeper pullback while below this threshold with weekly support seen at the 75% parallel of the ascending pitchfork formation we’ve been tracking off the 2016 / 2018 lows around ~1470 and the 100% extension at 1451 – weakness beyond this level would suggest a larger correction is underway. Topside targets are unchanged in the event of a breach with such a scenario exposing subsequent resistance objectives at 1558 and the key 61.8% retracement of the decline off the 2011 record highs at 1586.
For a complete breakdown of Michael’s trading strategy, review his Foundations of Technical Analysis series on Building a Trading Strategy
Bottom line: Gold prices remain at risk for further losses while below uptrend resistance here – form at trading standpoint, looking lower for now with a deeper set-back to offer more favorable long-entries closer to trend support. IF price breaks higher, we’ll look to fade weakness on a pullback into 1522 targeting a stretch towards Fibonacci resistance higher up. Review my latest Gold Price Outlook for a closer look at the near-term XAU/USD technical trading levels.
Even the most seasoned traders need a reminder every now and then- Avoid these Mistakes in your trading
Gold Trader Sentiment - XAU/USD Price Chart
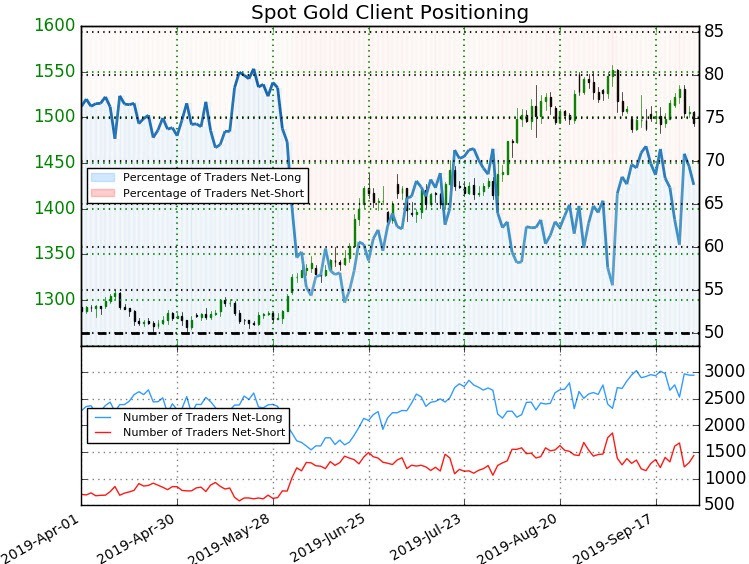
- A summary of IG Client Sentiment shows traders are net-long Gold - the ratio stands at +2.05 (67.2% of traders are long) – bearish reading
- Long positions are 2.4% lower than yesterday and 0.1% higher from last week
- Short positions are 9.1% higher than yesterday and 2.4% higher from last week
- We typically take a contrarian view to crowd sentiment, and the fact traders are net-long suggests Spot Gold prices may continue to fall. Yet traders are less net-long than yesterday and compared with last week. Recent changes in sentiment warn that the current Spot Gold price trend may soon reverse higher despite the fact traders remain net-long.
See how shifts in Gold retail positioning are impacting trend- Learn more about sentiment!
Previous Weekly Technical Charts
- Crude Oil (WTI)
- Euro (EUR/USD)
- Canadian Dollar (USD/CAD)
- Japanese Yen (USD/JPY)
- US Dollar Index (DXY)
- Australian Dollar (AUD/USD)
--- Written by Michael Boutros, Technical Currency Strategist with DailyFX
Follow Michael on Twitter @MBForex


