


- USD/JPY testing weekly downtrend resistance ahead of Fed- rally vulnerable sub-108.41
- Check out our 2019 projections in our Free DailyFX USD/JPY Trading Forecasts
- Join Michael for Live Weekly Strategy Webinars on Mondays at 12:30GMT
The US Dollar has rallied more than 3.6% against the Japanese Yen since the August lows / yearly lows with price now approaching broader downtrend resistance ahead of tomorrow’s highly anticipated FOMC interest rate decision. These are the updated targets and invalidation levels that matter on the USD/JPY weekly price chart. Review my latestWeekly Strategy Webinar for an in-depth breakdown of this USD price setup and more.
New to Forex Trading? Get started with this Free Beginners Guide
Japanese Yen Price Chart – USD/JPY Weekly
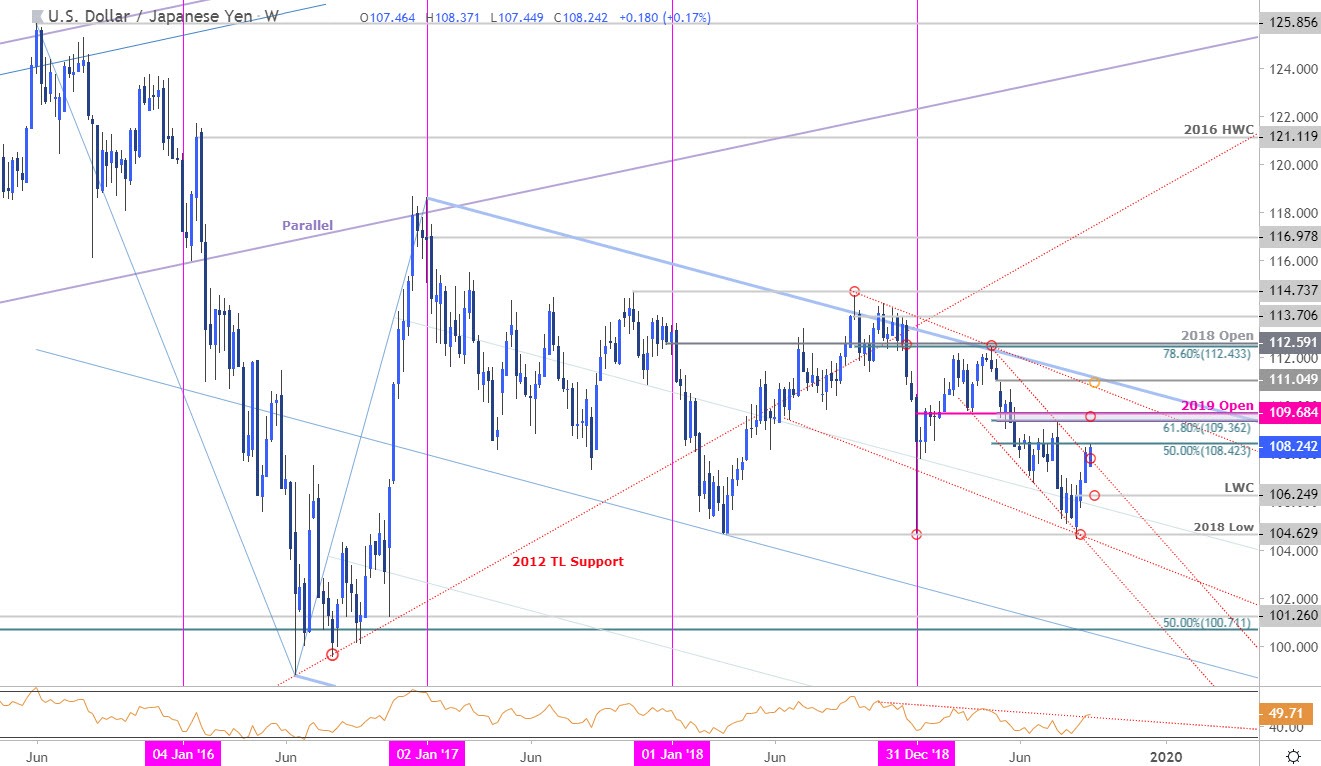
Chart Prepared by Michael Boutros, Technical Strategist; USD/JPY on Tradingview
Notes: In my last USD/JPY Price Outlook we identified a, “clean weekly opening range just below downtrend resistance and we’re looking for the break for guidance on our near-term directional bias.” A topside breach days later saw price mount a multi-week advance with USD/JPY now approaching channel resistance / the 50% retracement of the yearly range at 108.42.
Note that a weekly momentum trigger is being tested in RSI – a topside breach there with a weekly close above this is resistance zone in price is needed to keep the immediate rally viable targeting subsequent resistance objectives at the 61.8% retracement / yearly open at 109.36/68. Initial support rests with the low-week close at 106.25 – weakness (on a close basis) below this threshold would mark resumption of the broader down trend and risk another test of the lows.
For a complete breakdown of Michael’s trading strategy, review his Foundations of Technical Analysis series on Building a Trading Strategy
Bottom line: USD/JPY is testing downtrend resistance here and puts the immediate advance at risk while below 108.42. From a trading standpoint, a good spot to reduce long-exposure / raise protective stops. A topside breach looks for a larger reaction at 109.36/68. IF price breaches this zone on FOMC BUT settles back to close the day below, look to fade strength towards 107and beyond. I’ll publish an updated USD/JPY Technical Outlook once we get further clarity on the near-term price action.
Japanese Yen Trader Sentiment - USD/JPY Price Chart
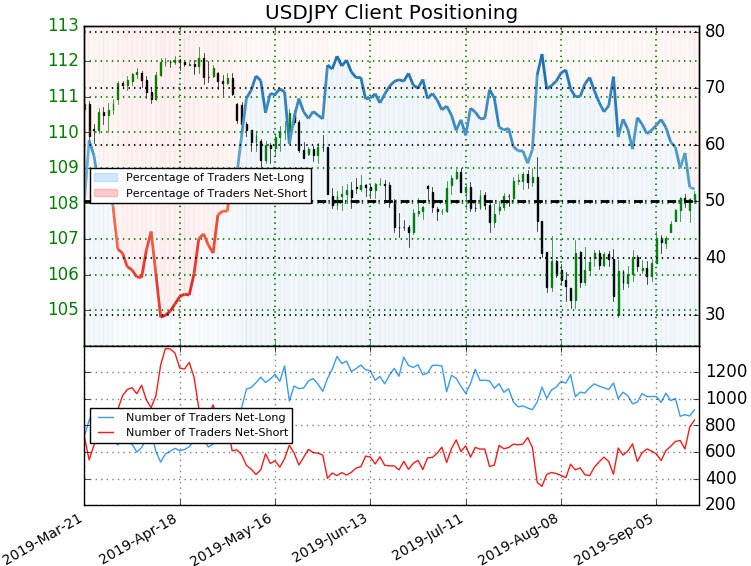
- A summary of IG Client Sentiment shows traders are net-long USD/JPY - the ratio stands at +1.09 (52.2% of traders are long) – neutral reading
- Traders have remained net-long since May 3rd; price has moved 3.3% lower since then
- Long positions are 2.7% higher than yesterday and 10.7% lower from last week
- Short positions are 15.0% higher than yesterday and 27.0% higher from last week
- We typically take a contrarian view to crowd sentiment, and the fact traders are net-long suggests USD/JPY prices may continue to fall. Yet traders are less net-long than yesterday and compared with last week. Recent changes in sentiment warn that the current USD/JPY price trend may soon reverse higher despite the fact traders remain net-long.
See how shifts in USD/JPY retail positioning are impacting trend- Learn more about sentiment!
---
Previous Weekly Technical Charts
- Gold (XAU/USD)
- US Dollar Index (DXY)
- Canadian Dollar (USD/CAD)
- Euro (EUR/USD)
- Australian Dollar (AUD/USD)
- Sterling (GBP/USD)
--- Written by Michael Boutros, Technical Currency Strategist with DailyFX
Follow Michael on Twitter @MBForex


