


The US Dollar reversed off long-term slope resistance this week, opening the door for further dollar losses. Here are the levels that matter on the DXY weekly chart.
- US Dollar fails long-term slope resistance- risk for further losses while below
- Check out our 2019 projections in our Free DailyFX USD Trading Forecasts
- Join Michael for Live Weekly Strategy Webinars on Mondays at 12:30GMT
The US Dollar breakout fizzled this week with the index falling more than 0.4% to trade at 98.38 ahead of the New York close on Friday. The greenback continues to test technical slope resistance with price unable to stabilize at fresh yearly highs this week. Here These are the updated targets and invalidation levels that matter on the DXY weekly price chart. Review my latestWeekly Strategy Webinar for an in-depth breakdown of this Dollar price setup and more.
New to Forex Trading? Get started with this Free Beginners Guide
US Dollar Index Price Chart - DXY Weekly
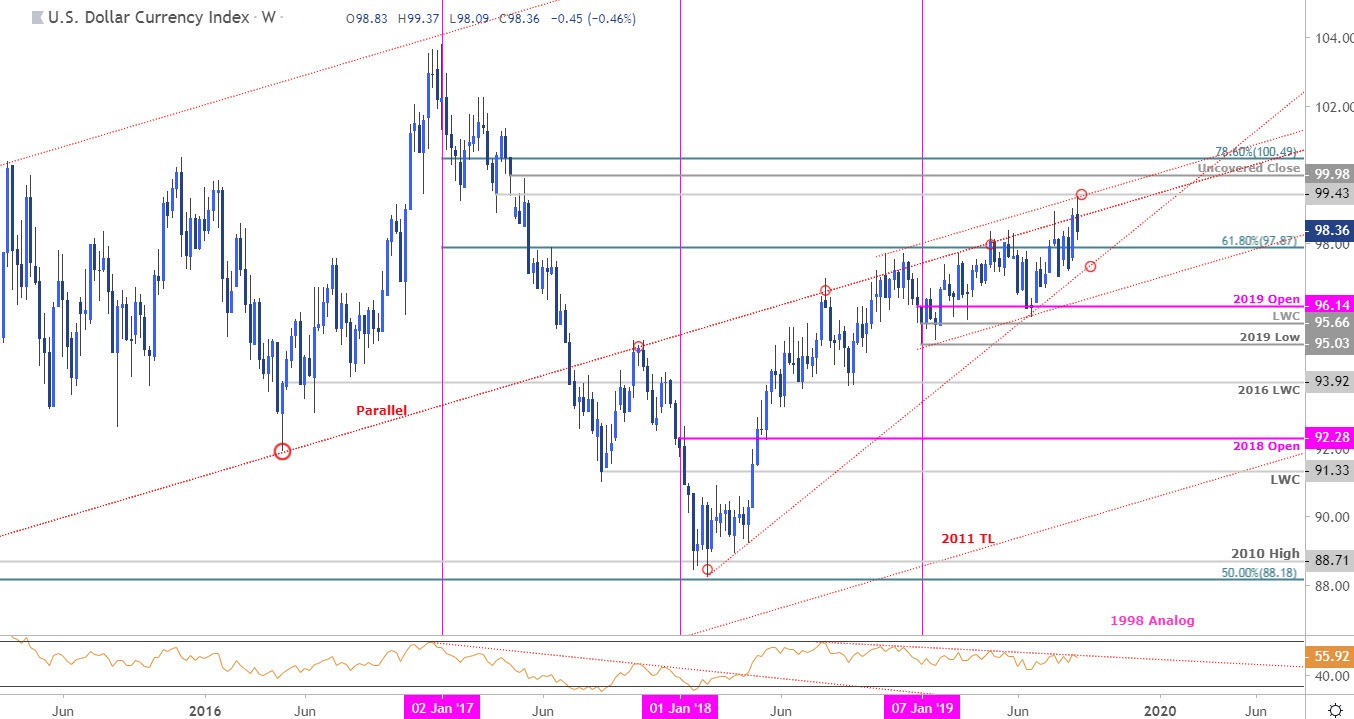
Chart Prepared by Michael Boutros, Technical Strategist; DXY on Tradingview
Notes:In my latest US Dollar Index Weekly Price Outlook we noted that DXY had, “US Dollar Index is testing long-term up-trend resistance again here – heading into the start of September trade, look for a reaction at this slope with a breach / close above needed to keep the broader long-bias viable.” Prices probed the upper parallel of the 2011 slope, extending off the 2018 high, early in the week before reversing sharply – note that weekly momentum has continued to hold below the 2018 resistance trigger and further highlights near-term risk for the Dollar.
Initial support rests with the 61.8% retracement of the 2017 decline at 97.87 with a break below the 2018 trendline (currently ~97.20s) needed to suggest a more significant high was registered this week. Look for monthly open resistance at 98.83 with a breach / close above 99.43 needed to fuel a breakout targeting the 2017 uncovered close at 99.98.
For a complete breakdown of Michael’s trading strategy, review his Foundations of Technical Analysis series on Building a Trading Strategy
Bottom line:The US Dollar Index failed yet another attempt at a breach above long-term uptrend resistance and remains at risk for a larger pullback while below this slope. From a trading standpoint, the immediate risk is side-ways to lower – look for exhaustion ahead of monthly open resistance on rebounds IF the greenback is indeed heading lower. Ultimately, a deeper correction may offer more favorable entries closer to trend support.
Even the most seasoned traders need a reminder every now and then- Avoid these Mistakes in your trading
---
Previous Weekly Technical Charts
- Gold (XAU/USD)
- Canadian Dollar (USD/CAD)
- Euro (EUR/USD)
- Australian Dollar (AUD/USD)
- US Dollar Index (DXY)
- Sterling (GBP/USD)
Learn how to Trade with Confidence in our Free Trading Guide
--- Written by Michael Boutros, Technical Currency Strategist with DailyFX
Follow Michael on Twitter @MBForex


