


- US Dollar breakout testing uptrend resistance into the start of September
- Check out our 2019 projections in our Free DailyFX USD Trading Forecasts
- Join Michael for Live Weekly Strategy Webinars on Mondays at 12:30GMT
The US Dollar is probing fresh yearly highs at levels not seen since May of 2017 with the advance now testing uptrend resistance. While the broader outlook remains constructive, the immediate rally may be vulnerable at these levels in to the open of September trade. Here These are the updated targets and invalidation levels that matter on the DXY weekly price chart. Review my latestWeekly Strategy Webinar for an in-depth breakdown of this Dollar price setup and more.
New to Forex Trading? Get started with this Free Beginners Guide
US Dollar Index Price Chart - DXY Weekly
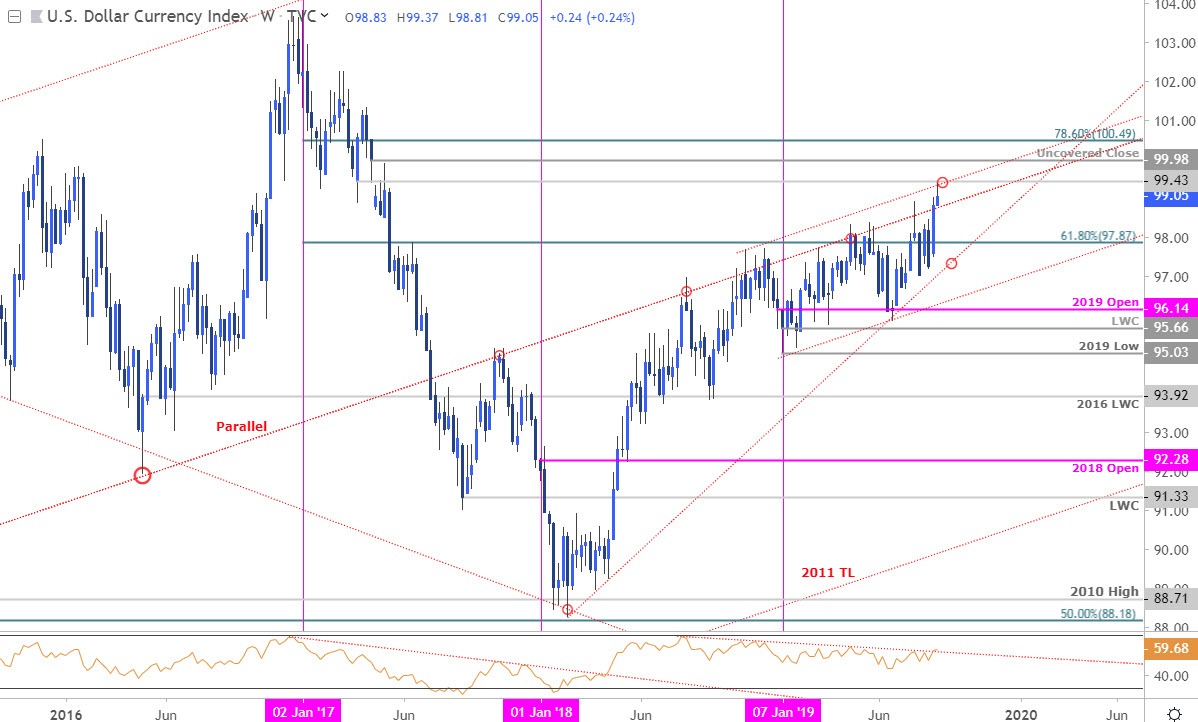
Chart Prepared by Michael Boutros, Technical Strategist; DXY on Tradingview
Notes: In last month’s US Dollar Index Weekly Price Outlook we noted that DXY was, “approaching long-term uptrend resistance,” at a slope we’ve been tracking for years now. The trendline in focus is the parallel of the 2011 slope, extended off the 2012 highs – this gradient has been pivotal in USD price action, calling the 2016 lows & the October 2017 highs and governing the 2018 Dollar advance into this year. Another parallel extending off the 2018 highs suggests the greenback may still be at risk here with a close above 99.43 needed to validate a breach of up-trend resistance.
Subsequent topside objectives are eye at the 2017 un-covered close at 99.98 backed by the 78.6% retracement of the 2017 decline at 100.49. Monthly open support at 98.83 backed by 97.87. Ultimately at break below the 2018 support line (currently ~97.30s) would be needed to suggest a more significant high is in place for the Dollar.
For a complete breakdown of Michael’s trading strategy, review his Foundations of Technical Analysis series on Building a Trading Strategy
Bottom line: The US Dollar Index is testing long-term up-trend resistance again here – heading into the start of September trade, look for a reaction at this slope with a breach / close above needed to keep the broader long-bias viable. From at trading standpoint a good place to reduce long-exposure / raise protect stops – be on the lookout for possible topside exhaustion this week while below the 2018 parallel. Ultimately a larger pullback would offer more favorable entries at trend support targeting a stretch into the 100-handle. A breach would likely see accelerated gains for the Dollar – stay nimble into the open.
Even the most seasoned traders need a reminder every now and then- Avoid these Mistakes in your trading
---
Previous Weekly Technical Charts
Learn how to Trade with Confidence in our Free Trading Guide
--- Written by Michael Boutros, Technical Currency Strategist with DailyFX
Follow Michael on Twitter @MBForex


