


- Gold prices testing critical resistance pivot at 1522/26–watch the close
- Check out our 2019 projections in our Free DailyFX Gold Trading Forecasts
- Join Michael for Live Weekly Strategy Webinars on Mondays at 12:30GMT
Gold prices are testing a critical resistance range early in the week and leaves the immediate recovery at risk. These are the updated targets and invalidation levels that matter on the XAU/USD charts this week. Review my latestWeekly Strategy Webinar for an in-depth breakdown of this Euro price setup and more.
New to Gold Trading? Get started with this Free How to Trade Gold -Beginners Guide
Gold Price Chart - XAU/USD Daily
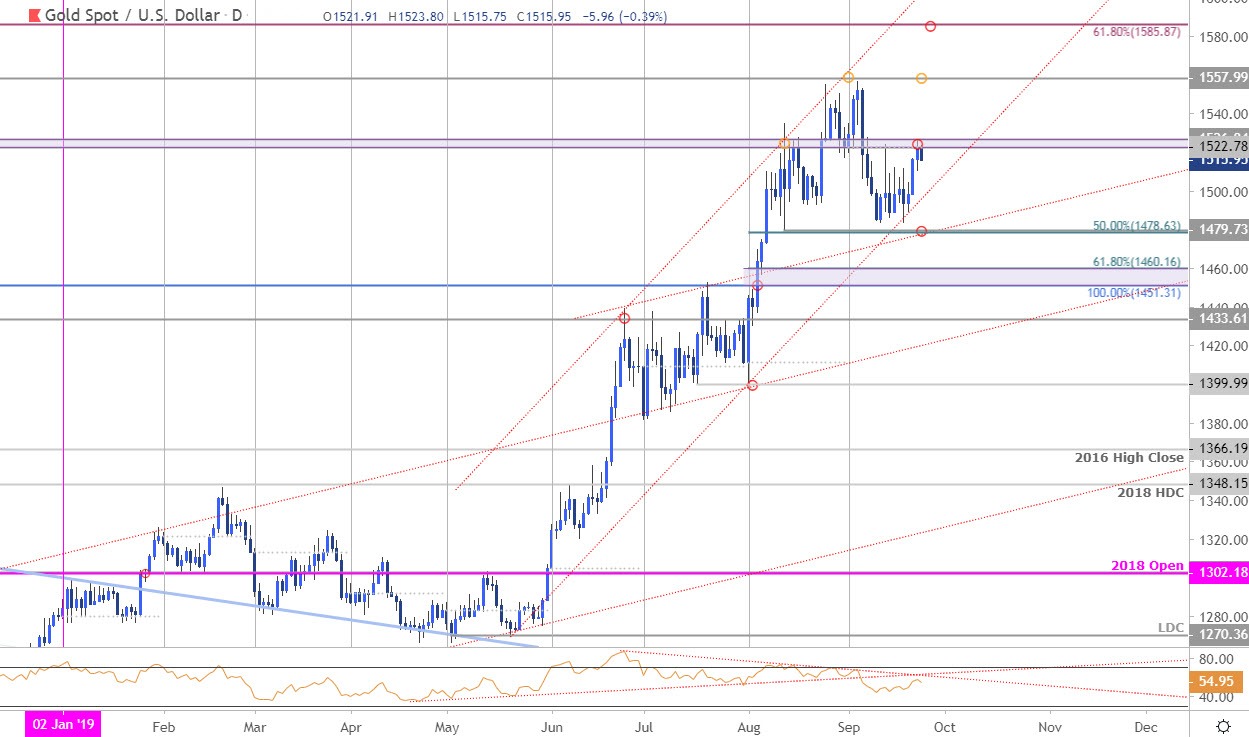
Chart Prepared by Michael Boutros, Technical Strategist; Gold on Tradingview
Technical Outlook: In my latest Gold Price Outlook we noted that the, “threshold in focus remains the 1522/26 confluence zone where the late-2011 & 2012 lows converge on the monthly open. Look for a reaction into this region IF reached with the broader advance vulnerable while below.” Price is testing this zone early in the week with a topside breach / close needed to shift the broader focus higher again in XAU/USD – we’re looking for a reaction here.
Gold Price Chart - XAU/USD 120min
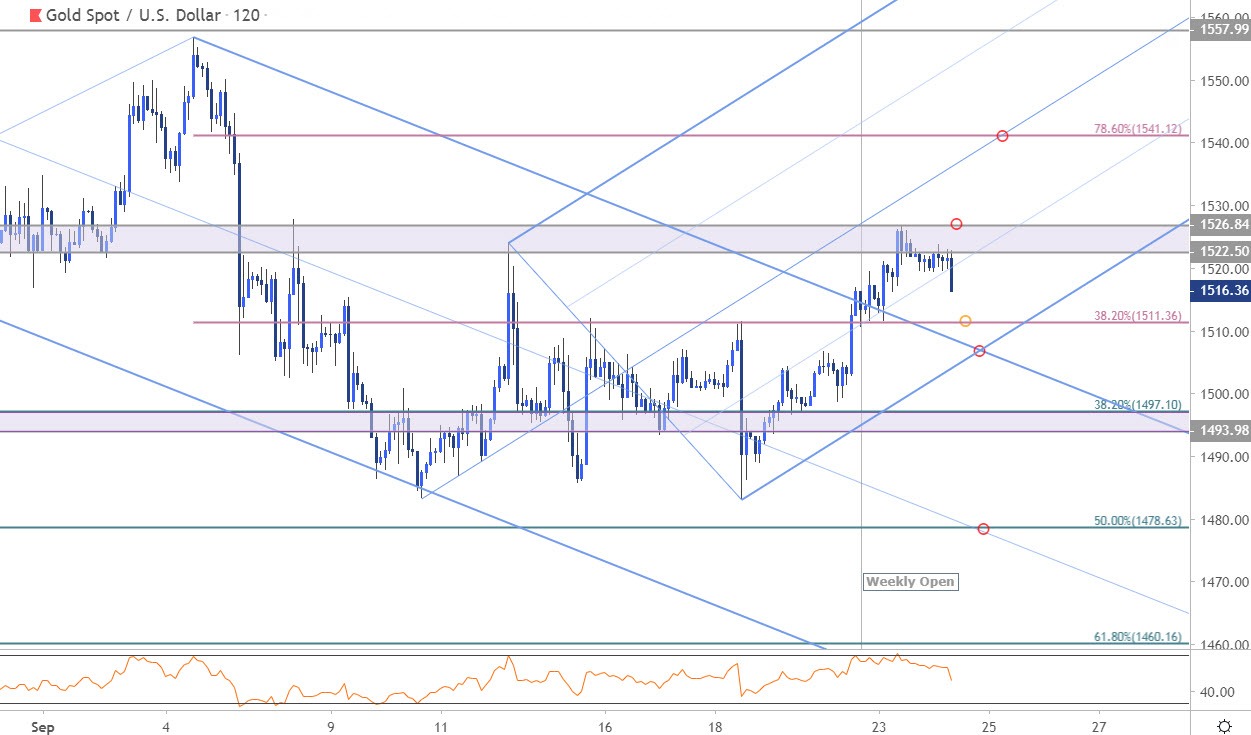
Notes: A closer look at gold price action shows XAU/USD trading within the confines of a near-term ascending pitchfork formation extending off the monthly lows with price carving the weekly opening-range just below the 1522/26 resistance zone.
Initial support rests at 1511 backed by the trendline confluence around ~1506 – a break below this zone would risk larger correction towards 1494/97 and 1479- look for a bigger reaction there IF reached. A topside breach of this threshold exposes subsequent resistance objectives at the 78.6% retracement at 1541 backed by 1558.
Why does the average trader lose? Avoid these Mistakes in your trading
Bottom line: The battle lines are drawn and the immediate focus is on a reaction here at 1522/26 with the gold price recovery at risk while below- watch the close. From at trading standpoint, a good spot to reduce long-exposure / raise protective stops. Failure here would risk a larger breakdown towards near-term uptrend support. Stay nimble - a topside breach would likely see accelerated gains in price. Review my latest Gold Price Weekly Outlook for a closer look at the longer-term XAU/USD technical trading levels.
For a complete breakdown of Michael’s trading strategy, review his Foundations of Technical Analysis series on Building a Trading Strategy
Gold Trader Sentiment - XAU/USD Price Chart
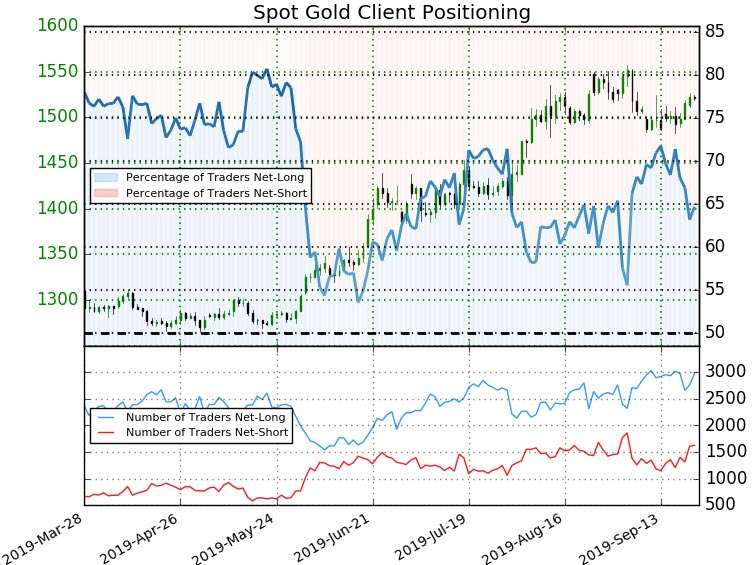
- A summary of IG Client Sentiment shows traders are net-long Gold- the ratio stands at +1.83 (64.7% of traders are long) – bearishreading
- Long positions are7.8% higher than yesterday and 1.0% lower from last week
- Short positions are13.2% higher than yesterday and 20.1% higher from last week
- We typically take a contrarian view to crowd sentiment, and the fact traders are net-long suggests Spot Gold prices may continue to fall. Yet traders are less net-long than yesterday and compared with last week. Recent changes in sentiment warn that the current Spot Gold price trend may soon reverse higher despite the fact traders remain net-long.
See how shifts in Gold retail positioning are impacting trend- Learn more about sentiment!
---
Active Trade Setups
- Australian Dollar Price Outlook: Aussie Drops into Downtrend Support
- Canadian Dollar Price Outlook: USD/CAD Rally at Resistance into FOMC
- Euro Price Outlook: EUR/USD Breakout Targets- Battle Lines Drawn
- Swiss Franc Price Outlook: USD/CHF Rally Grinds into Trend Resistance
- Near-term Trade Setups in USD/CAD, GBP/USD & USD/CHF
- Sterling Price Outlook: British Pound Rally Stalls– GBP/USD Levels
- Written by Michael Boutros, Currency Strategist with DailyFX
Follow Michael on Twitter @MBForex


