


- USD/CAD holds key range post-FOMC – broader risk remains lower sub-1.3355/70
- Check out our 2019 projections in our Free DailyFX USD Trading Forecasts
- Join Michael for Live Weekly Strategy Webinars on Mondays at 12:30GMT
The Canadian Dollar is up down more-than 0.2% against the US Dollar since the start of the week with USD/CAD stretching into near-term resistance post- FOMC yesterday. Despite the recent advance, Loonie remains within the confines of a well-defined range with the broader outlook still tilted to the downside. These are the updated targets and invalidation levels that matter on the USD/CAD weekly chart. Review my latest Weekly Strategy Webinar for an in-depth breakdown of this Euro price setup and more.
New to Forex Trading? Get started with this Free Beginners Guide
Canadian Dollar Price Chart – USD/CAD Weekly
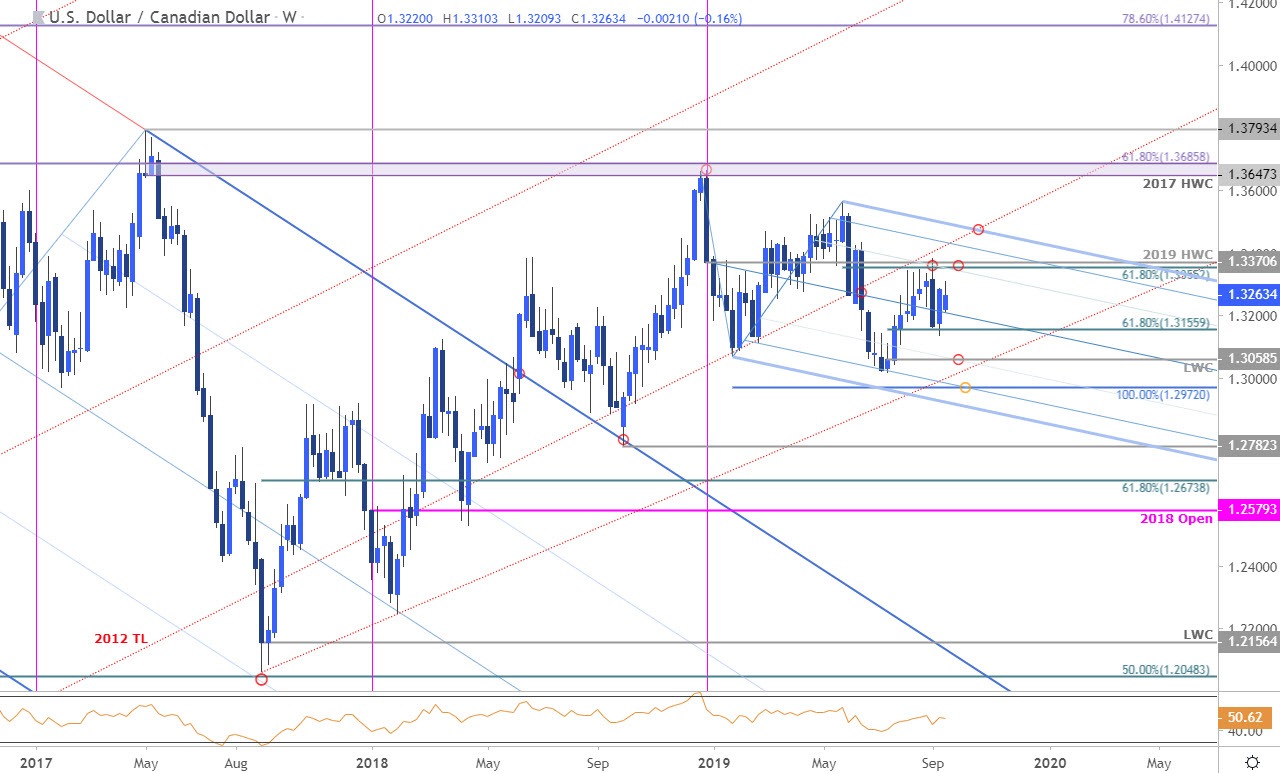
Chart Prepared by Michael Boutros, Technical Strategist; USD/CAD on Tradingview
Notes: In my last Canadian Dollar Price Outlook we noted that USD/CAD was approaching daily resistance at, “1.3288- a close above this threshold is needed to keep the near-term long-bias viable.” A brief stint above pulled back with price closing precisely at 1.3288 on the heels of the FOMC. Note that USD/CAD continues to trade within the confines of the early September outside-weekly reversal range and the focus remains on a break of this zone for guidance with the broader risk lower while below key resistance at 1.3355/70- a region defined by the 61.8% retracement of the May decline.
Initial support rests with the median-line of the descending pitchfork formation we’ve been tracking off the 2018 high with a break / close below 1.3155 needed to fuel the next leg lower in USD/CAD. Such a scenario would expose downside support objectives at the low-week close at 1.3059 and the 100% extension of the yearly January decline at 1.2972.
For a complete breakdown of Michael’s trading strategy, review his Foundations of Technical Analysis series on Building a Trading Strategy
Bottom line: The broader focus remains on a break of the 1.3155- 1.3355 zone for guidance on our near-term directional bias. From a trading standpoint, we’ll continue to favor fading strength while within this formation targeting a downside break of the September opening-range. Review my latest Canadian Dollar Price Outlook for a closer look at the near-term technical trading levels for USD/CAD.
Canadian Dollar Trader Sentiment – USD/CAD Price Chart
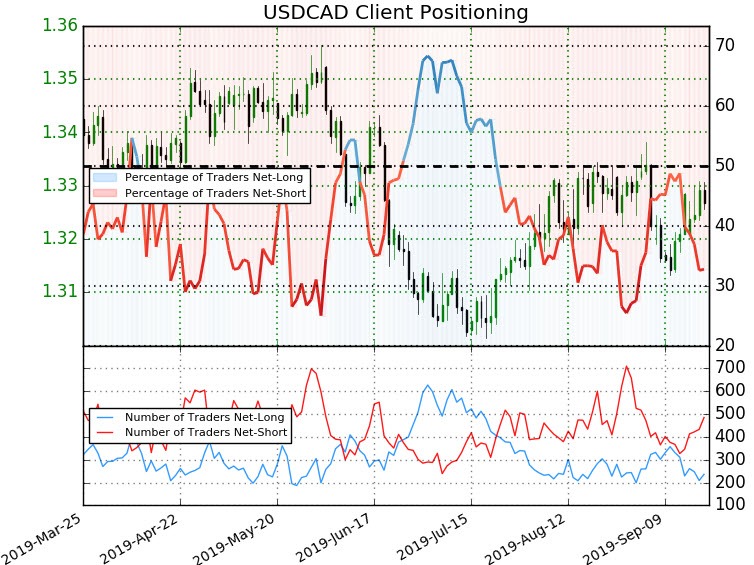
- A summary of IG Client Sentiment shows traders are net-short USD/CAD - the ratio stands at -2.06 (32.7% of traders are long) – bullish reading
- Traders have remained net-short since September 12th; price has moved 0.4% higher since then
- Long positions are 16.3% lower than yesterday and 39.0% lower from last week
- Short positions are7.8% higher than yesterday and 34.3% higher from last week
- We typically take a contrarian view to crowd sentiment, and the fact traders are net-short suggests USD/CAD prices may continue to rise. Traders are further net-short than yesterday & last week, and the combination of current positioning and recent changes gives us a stronger USD/CAD-bullish contrarian trading bias from a sentiment standpoint.
See how shifts in Loonie retail positioning are impacting trend- Learn more about sentiment!
---
Previous Weekly Technical Charts
- Japanese Yen (USD/JPY)
- Gold (XAU/USD)
- US Dollar Index (DXY)
- Euro (EUR/USD)
- Australian Dollar (AUD/USD)
- Sterling (GBP/USD)
--- Written by Michael Boutros, Technical Currency Strategist with DailyFX
Follow Michael on Twitter @MBForex


