


- Oil prices plummet nearly 4% since the start of the week- risk remains lower sub-60.47
- Check out our 2019 projections in our Free DailyFX Oil Price Trading Forecasts
- Join Michael for Live Weekly Strategy Webinars on Mondays at 12:30GMT
Oil prices have remained under pressure since last week’s +15% range in price with crude pulling back below downtrend resistance, nearly paring the entire advance. The decline is now approaching monthly open support and we’re looking for a reaction in price. These are the updated targets and invalidation levels that matter on the oil weekly price chart (WTI). Review my latest Weekly Strategy Webinar for an in-depth breakdown of this Aussie price setup and more.
New to Forex Trading? Get started with this How to Trade Crude Oil Beginners Guide
Oil Price Chart – WTI Weekly
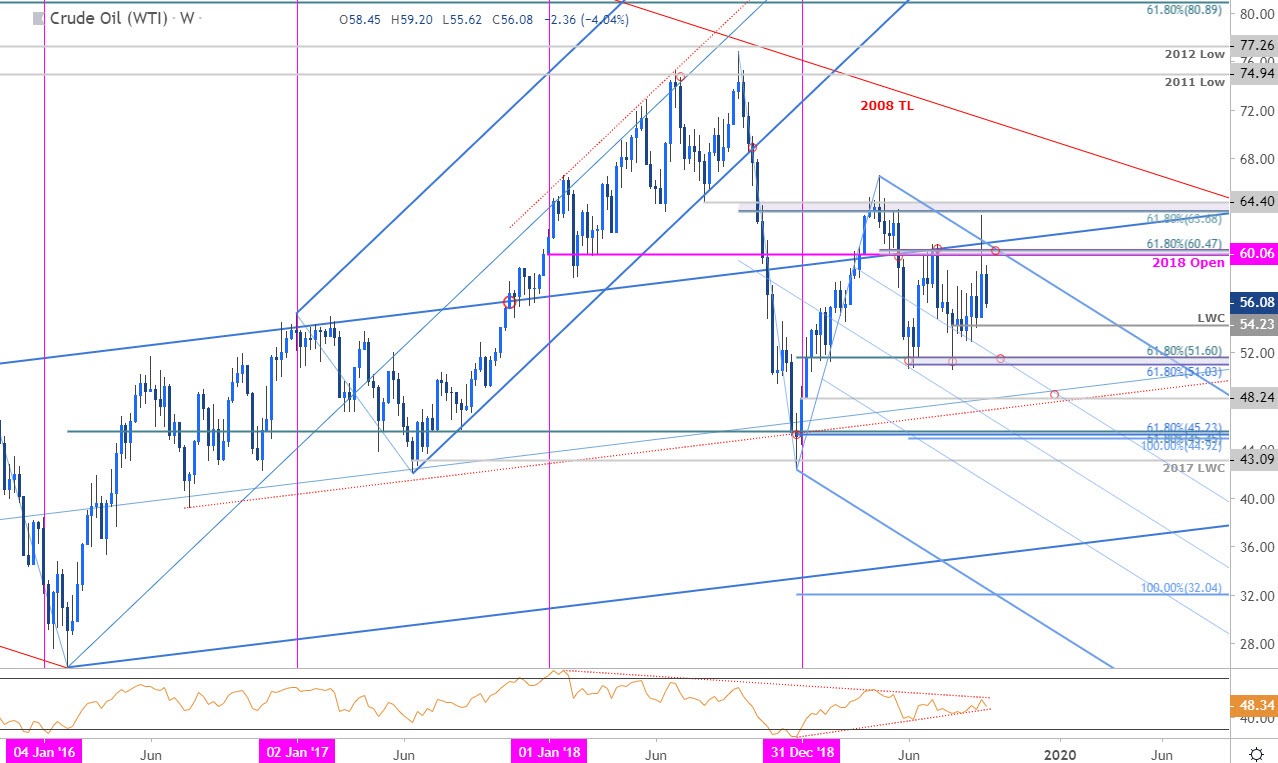
Chart Prepared by Michael Boutros, Technical Strategist; Oil (WTI) on Tradingview
Notes: Crude prices posted the largest single-week range since November 2014 last week with price failing to close above a critical resistance confluence at 60.06/47 – a region defined by the 2018 yearly open and the 61.8% retracement of the late-April decline. Note that weekly momentum has continued to compress into the apex of a consolidation pattern and we’re looking for the break to offer further guidance / validation of the near-term directional bias.
Despite the recent price spike, oil continues to trade within the confines of a modified descending pitchfork formation extending off the 2018 / 2019 highs and keeps the broader outlook tilted to the downside while below the upper parallel. Initial support rests with the low-week close at 54.23 with key support steady at 51.03/60 Fibonacci confluence – look for a bigger reaction there IF reached. Subsequent support objectives at 48.24 and 44.92-45.23 (key) in the event of a break. A topside breach / close above 64.40 would ultimately be needed to shift the broader focus higher in oil prices.
For a complete breakdown of Michael’s trading strategy, review his Foundations of Technical Analysis series on Building a Trading Strategy
Bottom line: Crude oil prices failed at key confluence resistance last week and leaves the broader downtrend intact. Form a trading standpoint, looking sideways to lower for now with a break of the pending momentum consolidation to offer further guidance. We’ll favor fading strength while below the upper parallel ultimately targeting a test / break below the August low-week close.
Crude Oil Trader Sentiment – WTI Price Chart
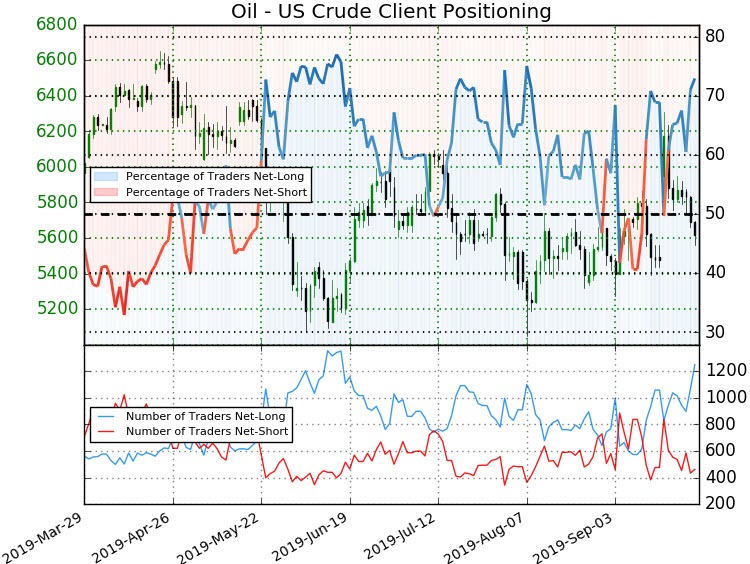
- A summary of IG Client Sentiment shows traders are net-long Oil - the ratio stands at +2.7 (73.0% of traders are long) – bearish reading
- Traders have remained net-long since September 16th; price has moved 4.6% lower since then
- The percentage of traders net-long is now its highest since August 1st
- Long positions are 22.8% higher than yesterday and 15.9% higher from last week
- Short positions are 19.3% lower than yesterday and 31.3% lower from last week
- We typically take a contrarian view to crowd sentiment, and the fact traders are net-long suggests Oil - US Crude prices may continue to fall. Traders are further net-long than yesterday & last week, and the combination of current positioning and recent changes gives us a stronger Oil-bearish contrarian trading bias from a sentiment standpoint.
See how shifts in crude oil retail positioning are impacting trend- Learn more about sentiment!
---
Previous Weekly Technical Charts
- Euro (EUR/USD)
- Gold (XAU/USD)
- Canadian Dollar (USD/CAD)
- Japanese Yen (USD/JPY)
- US Dollar Index (DXY)
- Australian Dollar (AUD/USD)
--- Written by Michael Boutros, Technical Currency Strategist with DailyFX
Follow Michael on Twitter @MBForex


