


Canadian Dollar Outlook:
- USD/JPY’s rise is helping provoke a divergence between CAD/JPY and USD/CAD rates.
- Weaker oil prices and a stronger US Dollar are propping up USD/CAD rates, while rising bond yields and firmer equity markets are helping push CAD/JPY rates higher.
- According to the IG Client Sentiment Index, USD/CAD rates have a bullish bias in the near-term.

Major Pairs Move in Different Directions
The Canadian Dollar’s weak November has continued in some places, but has reversed course in others. Weaker crude oil prices aren’t doing the Loonie any favors, as the 20-day correlation between crude oil prices and USD/CAD is -0.62, while the 20-day correlation between crude oil prices and CAD/JPY is +0.41. Nor are Canadian fundamental trends; the Canada Citi Economic Surprise Index is now down to +7.7 after starting the month at +31.6.
For the most part, influences abroad are doing most of the heavy lifting for CAD-crosses. Rising bond yields and higher equity markets are sapping demand for safe havens like the Japanese Yen and Swiss Franc. Weakness in continental Europe is favoring CAD strength in pairs like CAD/CHF and EUR/CAD, while rising rate hike expectations among the Bank of England and Federal Reserve are helping lift pairs like GBP/CAD and USD/CAD.
It may be the case that, until crude oil prices make a decisive break out of their range, CAD-crosses continue to diverge and act on the merits of their secondary currencies; CAD/JPY and USD/CAD rates could both rise in the short-term.
CAD/JPY Rate Technical Analysis: Daily Chart (November 2020 to November 2021) (Chart 1)
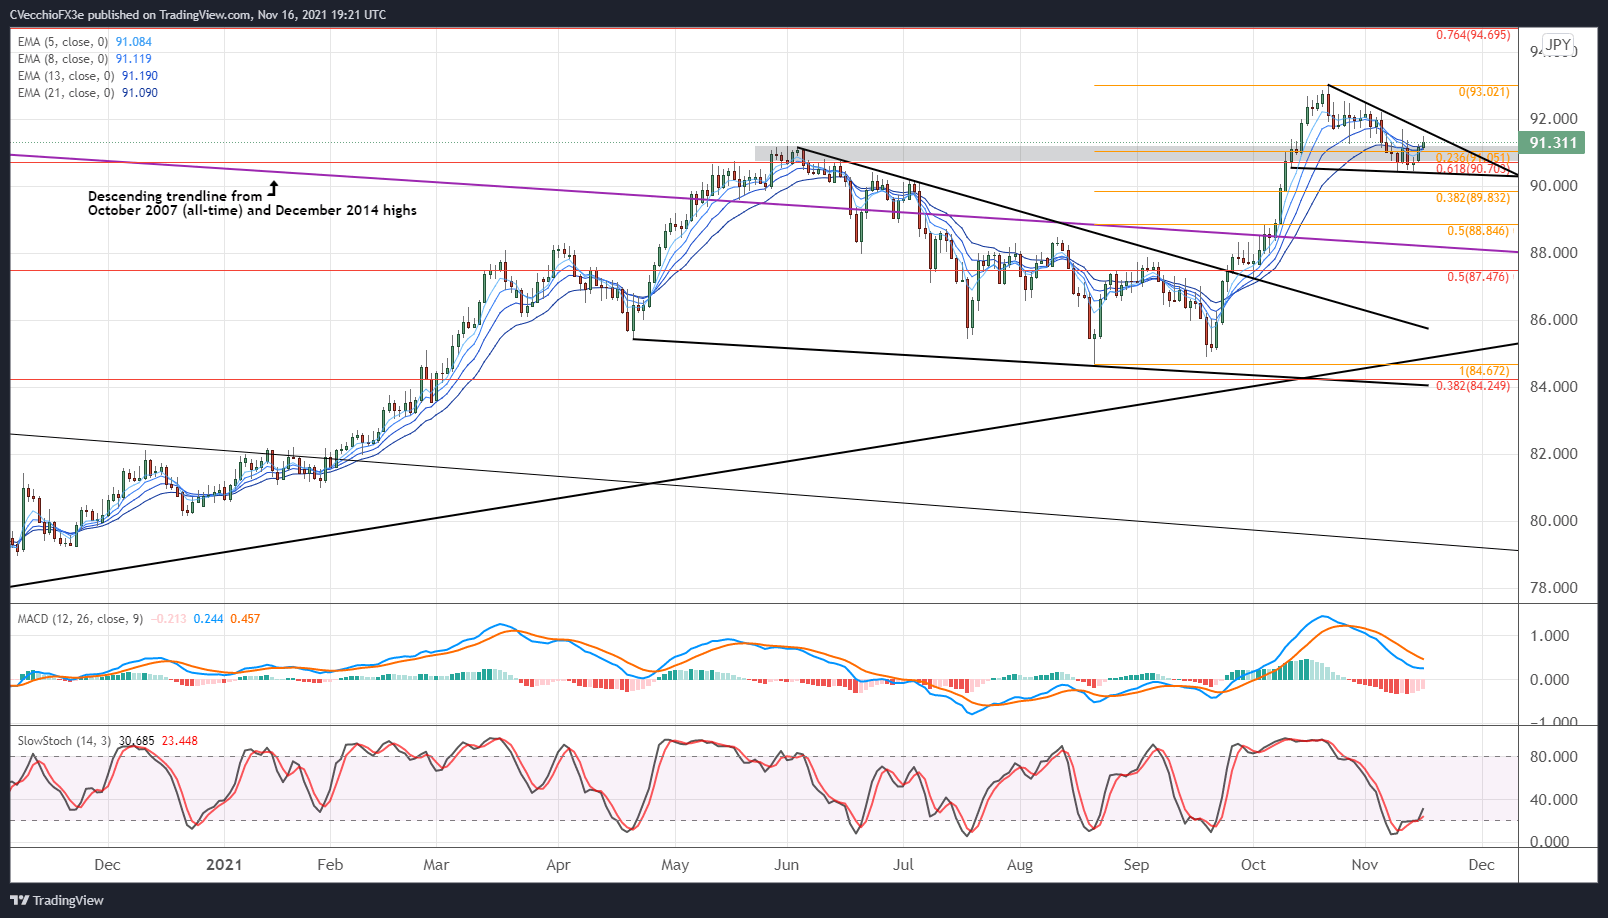
Last week it was noted that “CAD/JPY rates may soon experience a deeper pullback, continuing the trend in place since late-October.” That was wrong thus, with the pair having marked its monthly low the day that the prior update was issued. A different perspective is thus warranted.
It may be the case that CAD/JPY rates are consolidating into a bullish falling wedge or pennant over the past few weeks, with support coming in around the former yearly high zone set in late-May and early-June around 90.75/91.19 (the November low breached this area briefly, at 90.44). Likewise, a cluster of Fibonacci retracements between 90.70 and 91.05 are bolstering the wedge’s/pennant’s base.
Bearish momentum has been neutralized, insofar as daily MACD’s descent above its signal line is abating while daily Slow Stochastics have started to rise out of oversold territory. The pair is now above its daily 5-, 8-, 13-, and 21-EMA envelope, which is in neither bearish nor bullish sequential order. A move above 91.60 or below 90.40 is needed to determine the next directional move; until then, consolidation is the name of the game.
USD/CAD Rate Technical Analysis: Daily Chart (November 2020 to November 2021) (Chart 2)
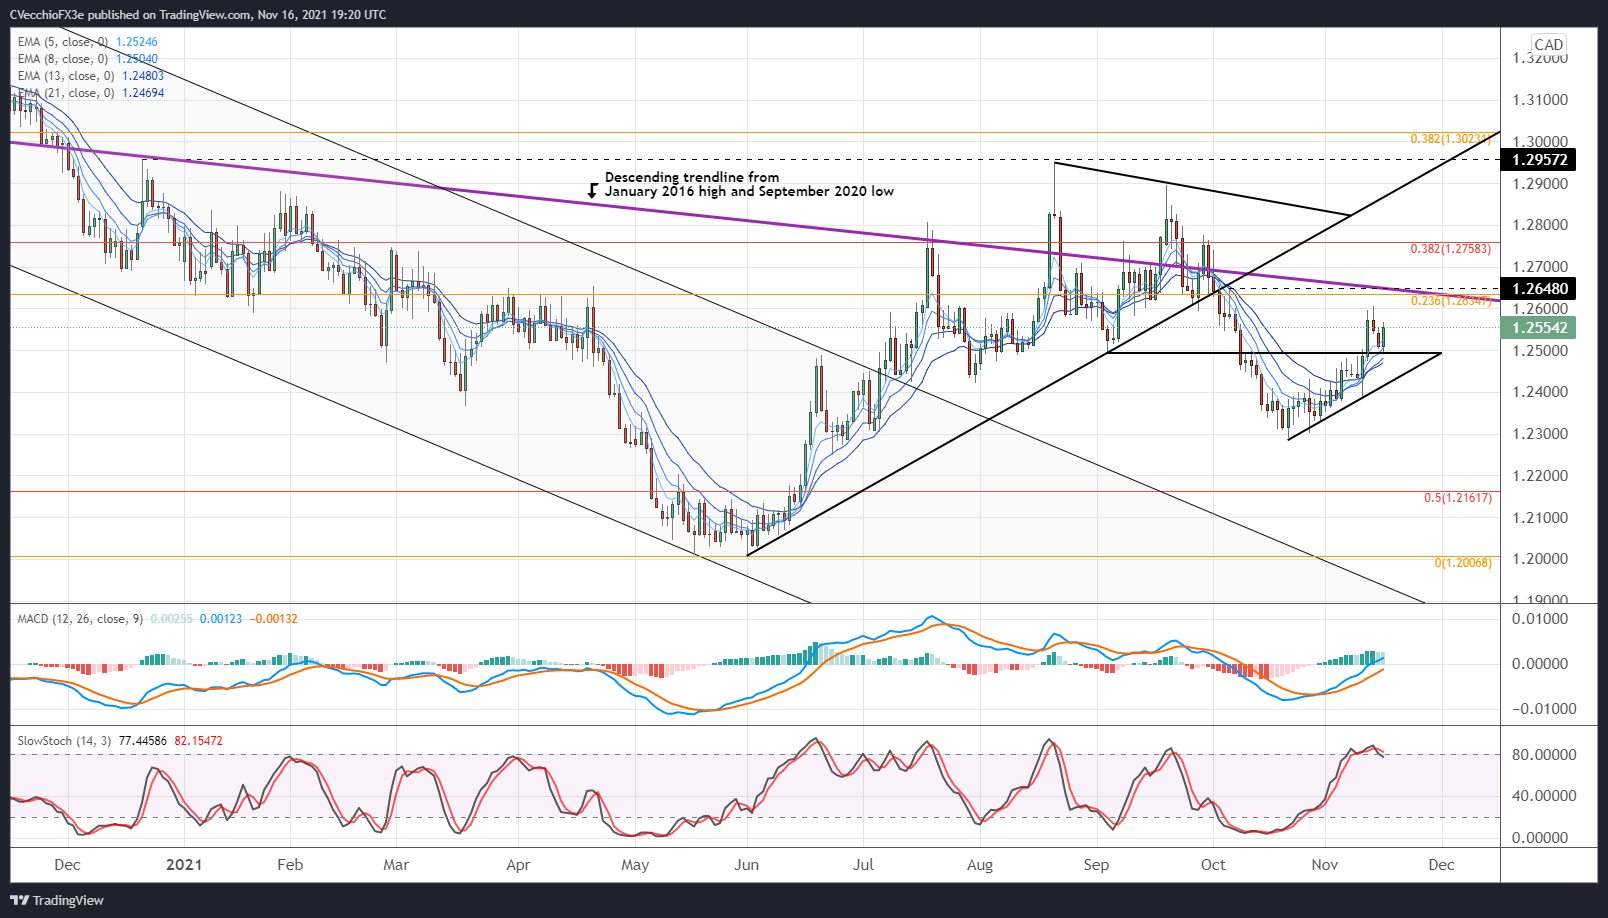
USD/CAD rates returned to former ascending triangle resistance at the September swing low and the October 12 high around 1.2595 this week before rebounding, suggesting that the bullish breakout last week has been validated with a back and fill. It remains the case that “more gains may be ahead in the coming day as the pair progresses towards the 23.6% Fibonacci retracement of the March 2020 high/June 2021 low range at 1.2635, which also coincides with the descending trendline from the January 2016 and September 2020 (a trendline that has served as resistance and support on numerous occasions over the past few years).”

IG Client Sentiment Index: USD/CAD Rate Forecast (November 16, 2021) (Chart 3)
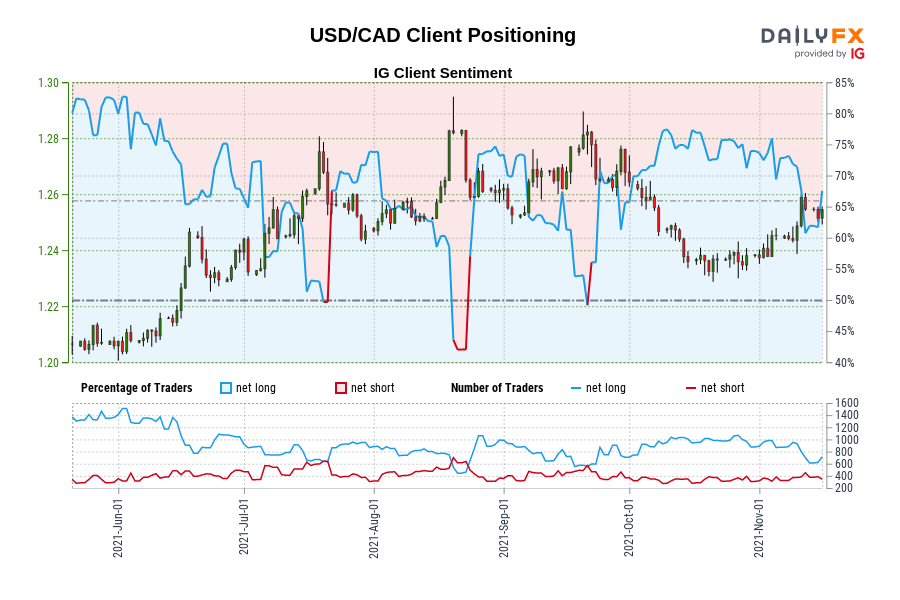
USD/CAD: Retail trader data shows 72.07% of traders are net-long with the ratio of traders long to short at 2.58 to 1. The number of traders net-long is 23.31% higher than yesterday and 13.57% lower from last week, while the number of traders net-short is 15.76% lower than yesterday and 14.88% lower from last week.
We typically take a contrarian view to crowd sentiment, and the fact traders are net-long suggests USD/CAD prices may continue to fall.
Traders are further net-long than yesterday and last week, and the combination of current sentiment and recent changes gives us a stronger USD/CAD-bearish contrarian trading bias.
--- Written by Christopher Vecchio, CFA, Senior Strategist


