


Crude Oil Outlook:
- Energy markets have cooled off in recent weeks, and a deeper setback in crude oil prices is possible before the rally resumes.
- A break of the November 4 low would put crude oil prices on a trajectory towards their year-long channel support, coming in closer to 71.00.
- According to the IG Client Sentiment Index, crude oil prices have a bearish bias.
Crude Oil Prices Hit a Slick
In the wake of the hot US inflation report released last week, crude oil prices have been sliding lower. As energy supply concerns persists, speculation has been gathering pace that the Biden administration would increase pressure on OPEC+ to increase supplies while simultaneously considering a release of inventories from the Strategic Petroleum Reserve (SPR) to alleviate pressure at the pump.
These near-term fundamental negatives have been met by a set of technical circumstances that have seen crude oil prices trade sideways for the better part of the last month. Last Wednesday’s daily candlestick after the October US CPI evolved into a bearish key reversal/outside engulfing bar (depending upon your perspective), suggesting that a near-term top has been carved out.
Now, while technical indicators suggest that more sideways action is likely, traders can’t yet rule out a deeper setback towards year-long channel support closer to 71.00 before the longer-term rally resumes.

Oil Volatility, Oil Price Correation Quite Normal
Crude oil prices have a relationship with volatility like most other asset classes, especially those that have real economic uses – other energy assets, soft and hard metals, for example. Similar to how bonds and stocks don’t like increased volatility – signaling greater uncertainty around cash flows, dividends, coupon payments, etc. – crude oil tends to suffer during periods of higher volatility.
OVX (Oil Volatility) Technical Analysis: Daily Price Chart (November 2020 to November 2021) (Chart 1)

Oil volatility (as measured by the Cboe’s gold volatility ETF, OVX, which tracks the 1-month implied volatility of oil as derived from the USO option chain) was trading at 36.62 at the time this report was written.
The 5-day correlation between OVX and crude oil prices is -0.15 while the 20-day correlation is -0.51; and one week ago, on November 8, the 5-day correlation was -0.80 and the 20-day correlation was -0.41.
Oil volatility continues to persist around levels experienced going back to 2019, suggesting normal price action in energy markets: higher volatility is bad for crude oil prices; and lower volatility is good.

Crude Oil Price Technical Analysis: Daily Chart (November 2020 to November 2021) (Chart 2)
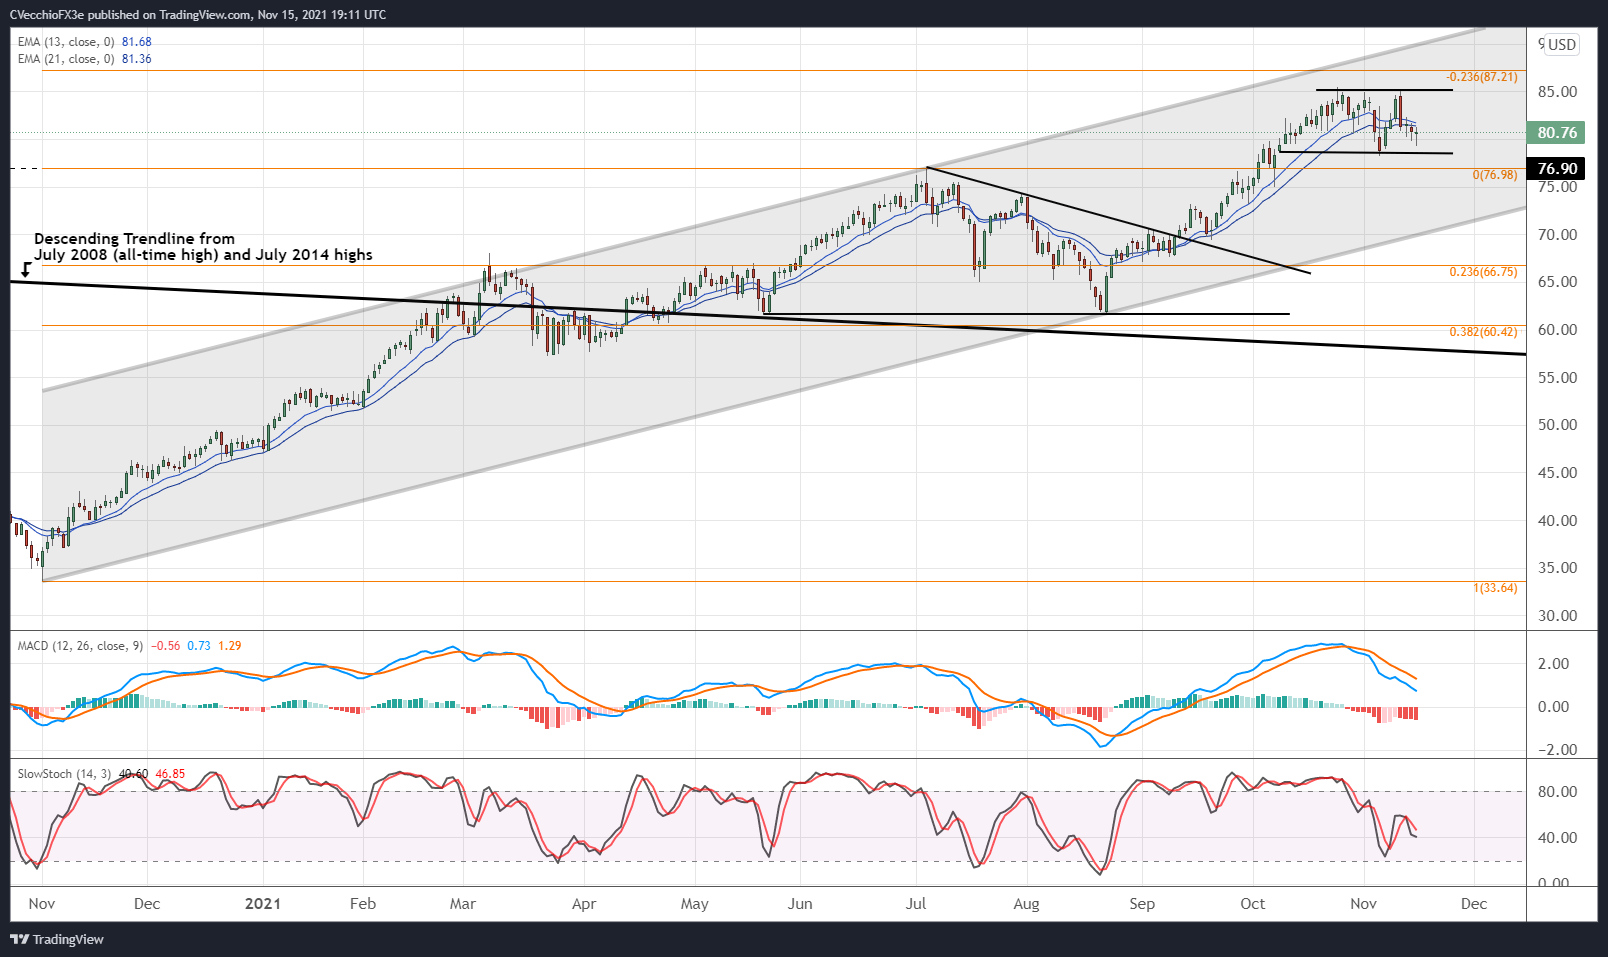
Crude oil’s technical structure is showing a clean sideways range between 78.25 and 85.41. But with last Wednesday’s candlestick, it appears that a potential double top may be forming. Momentum continues to erode in the short-term. Crude oil prices are below their daily 5-, 8-, 13-, and 21-EMA envelope, which is in bearish sequential order. Daily MACD is declining, but remains above its signal line. Meanwhile, daily Slow Stochastics are slumping and nearing a drop below their median line.
In the event that the November 4 low at 78.25 is breached, it would set crude oil prices on a technical trajectory looking for a measured move towards 71.09. A drop to 71.09 by the end of November would see crude oil prices return to parallel uptrend support in place off of the November 2020 and August 2021 swing lows.
Crude Oil Price Technical Analysis: Weekly Chart (January 2008 to November 2021) (Chart 3)
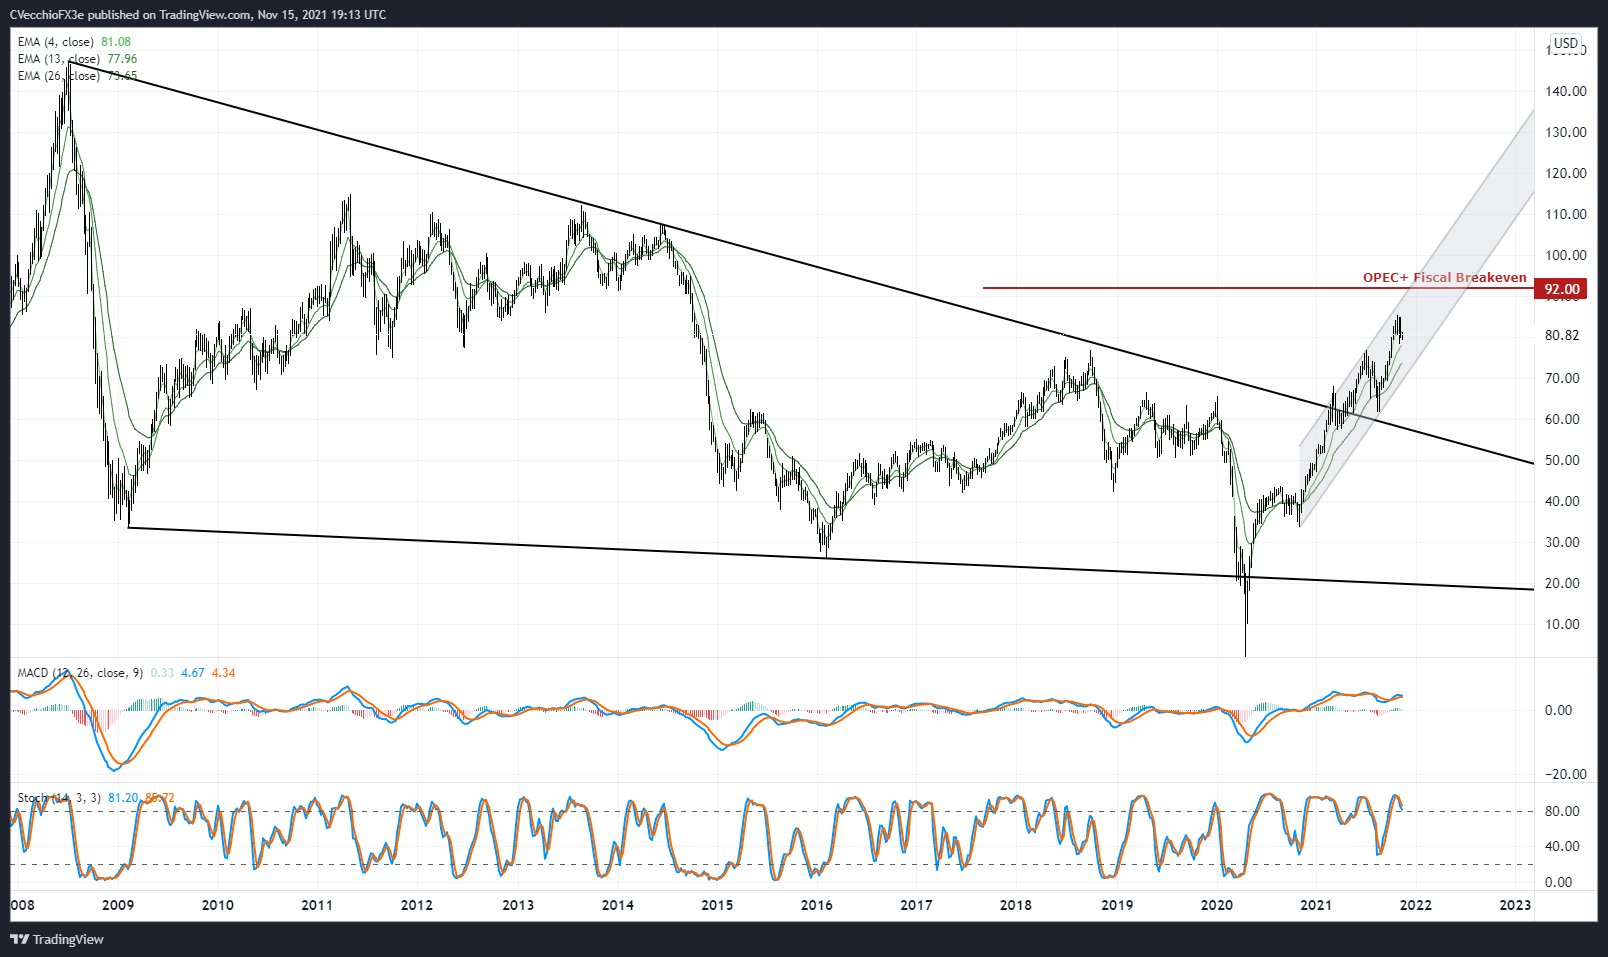
In mid-October it was noted that “crude oil prices may be hitting a near-term inflection point, however, with the backside of the rising trendline from the November 2020 and May 2021 lows coming into play at 82.60 in the coming week.” While crude oil prices advanced to fresh yearly highs at 85.41 soon after, crude oil was trading at 80.93 at the time this report was written – lower than where it was when we last checked in on October 11. As long as crude oil prices don’t lose 71.00 by the end of November, the year-long uptrend will remain valid thus keeping a ‘buy the dip’ mentality in place even if the market declines further in the near-term.
IG CLIENT SENTIMENT INDEX: CRUDE OIL PRICE FORECAST (November 15, 2021) (CHART 4)

Oil - US Crude: Retail trader data shows 57.34% of traders are net-long with the ratio of traders long to short at 1.34 to 1. The number of traders net-long is 18.77% higher than yesterday and 19.54% higher from last week, while the number of traders net-short is 8.94% higher than yesterday and 8.51% lower from last week.
We typically take a contrarian view to crowd sentiment, and the fact traders are net-long suggests Oil - US Crude prices may continue to fall.
Traders are further net-long than yesterday and last week, and the combination of current sentiment and recent changes gives us a stronger Oil - US Crude-bearish contrarian trading bias.

--- Written by Christopher Vecchio, CFA, Senior Strategist


