


Crude oil and natural gas Elliott wave talking points:
- An important top in crude oil formed at the October 3 high of 76.88
- A multi-month decline is likely underway and incomplete
- Natural Gas is nearing the final stage of an Elliott wave triangle that implies additional gains ahead
Crude Oil’s longer-term wave has shifted to the downside
Our previous longer-term Elliott wave forecast for crude oil from October 3 suggested a meaningful top may form near 77.31 or possibly 80. We later know that a high was formed that day at 76.88 in route to a 35% decline.
Therefore, we can consider the ((y)) wave complete which formed from August 30, 2017 to October 3, 2018. It is possible we can consider the whole upward sequence from February 2016 to October 3, 2018 as a complete wave. The ((y)) wave formed in 13 months so the implication is for a multi-month down wave that likely persists into 2019.

Interested in learning more about trading Oil? Check out How to Trade Oil
As is the case with any movement, the market does not trade in straight lines. We have enough evidence in place to consider the shorter-term wave over and a relief rally may have begun. This is a relief rally we expect to be a partial retracement of the downtrend and we expect it to hold below 76.88. Potential stopping points for this relief rally include 58.11 which is a former support level from early 2018. If that does not contain crude oil prices, then the market may find resistance near 65-68 which is a former congestion zone.
The current Elliott Wave patter for crude oil prices

New to Elliott wave corrective patterns? On page 2 of our Elliott wave Advanced guide, we explain the fractal nature of impulses and corrective patterns.
We are anticipating a bearish 5-3 pattern to offer some trading opportunities. A 5-3 pattern is a two-wave pattern such that the first wave is a motive wave (either impulse or diagonal) followed by a three-wave corrective pattern. It appears as though the first wave of the two-wave pattern is complete or nearly so. Therefore, we anticipate a relief rally to take on the structure of any three wave corrective form (zigzag, flat, triangle, or combination).
Some initial resistance levels we are following include 58.11 and 65-68 per barrel.
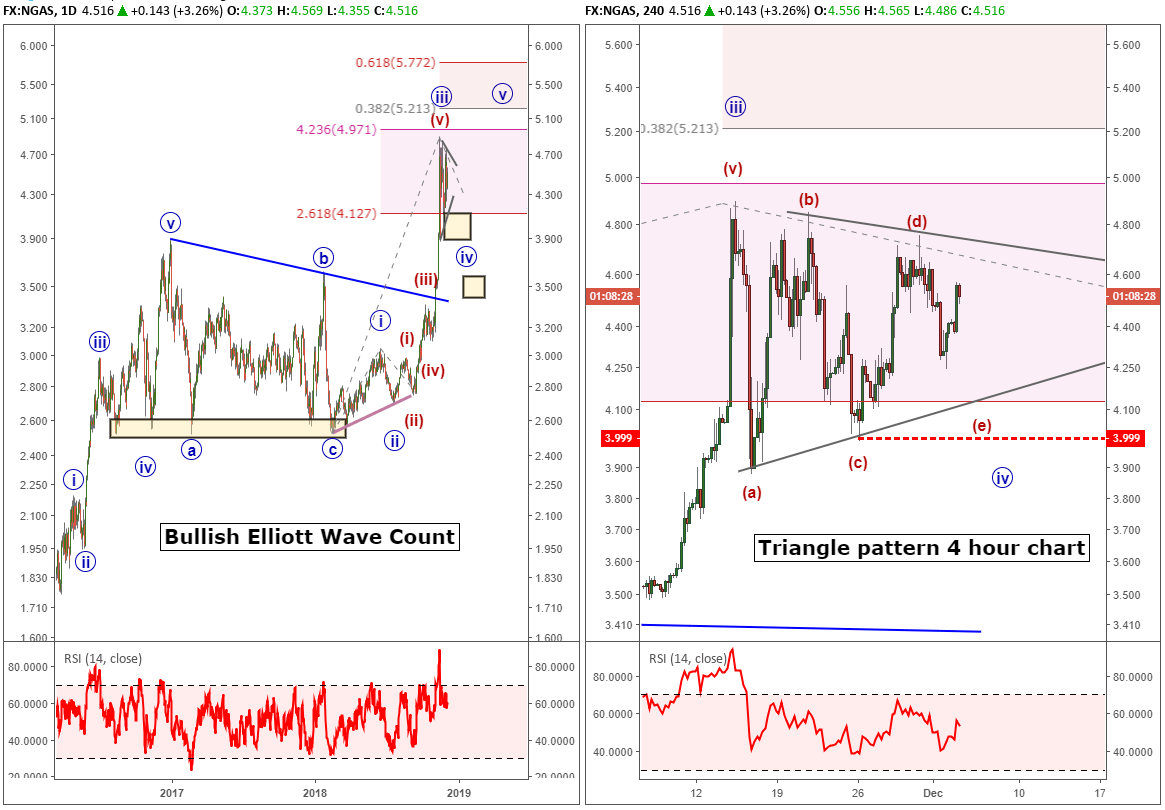
Natural Gas Elliott wave bullish pattern appears incomplete exposing 5.00
Our previous post on Natural Gas included a mixed bag offering a sideways to bearish pattern or an extremely bullish pattern at play. It was difficult to ascertain at that time which one would play out so it was important to follow Natural Gas prices and how they behaved near the key levels previously identified.
The bullish move made itself known and the recent high in Natural Gas prices is considered wave ((iii)). Natural Gas appears to be digesting sideways in a wave ((iv)) triangle which is common. The Elliott wave triangle pattern appears very mature and is nearing its end. A dip to about 4.15 would be normal and the triangle as displayed is valid so long as Natural Gas prices remain above 3.99.
Therefore, this should lead to a wave ((v)) higher that likely breaks 5.00 and possibly makes it to 5.2 and higher levels.
Interested in learning more about trading natural gas? Check out How to Trade Natural Gas
Elliott Wave FAQs
How does Elliott Wave theory work?
Elliott Wave Theory is a forex trading study that identifies the highs and lows of price movements on charts via wave patterns. Traders often analyze the 5-wave impulse sequence and 3-wave corrective sequence to help them trade forex strategically. We cover these wave sequences in our beginners and advanced Elliott Wave trading guide.
---Written by Jeremy Wagner, CEWA-M
Jeremy Wagner is a Certified Elliott Wave Analyst with a Master’s designation. These articles are designed to illustrate Elliott Wave applied to the current market environment. See Jeremy’s bio page for recent Elliott Wave articles to see Elliott Wave Theory in action.
Communicate with Jeremy and have your shout below by posting in the comments area. Feel free to include your Elliott Wave count as well.
Discuss this market with Jeremy in Monday’s US Opening Bell webinar.
Follow on twitter @JWagnerFXTrader .
RECENT ELLIOTT WAVE ARTICLES
USDJPY Technical Analysis: Inability to Break Higher Keeps Eyes on Lower
S&P 500 Still Below Resistance; ETH and XRP Continue to Fall
Ethereum Price Forecasted to see Large Gain using Elliott Wave Analysis


