


Gold Price Talking Points:
- Gold prices rushed higher on Tuesday evening/Wednesday morning as news of an Iranian missile strike hit the headlines, stoking fears of escalating tensions between the US and Iran.
- Gold prices pulled back as tensions calmed; but the longer-term bullish backdrop that’s been intact for over a year now remains. The big question for traders at this point is one of timing in that theme.

Gold Spikes to Six-Year-Highs as Fear Brings Back the Bulls
Gold prices were on a wild ride this week, surging up to yet another fresh six-year-high on Tuesday evening after reports of an Iran missile strike on military bases in Iraq. This extended the run that started a couple of weeks ago as Gold prices began to break-out again, rising above a symmetrical wedge formation that had built over the prior four months. This extended the bullish theme that remained so visible last year, with a total tally of 38.9% gained from the August 2018 low up to this week’s high. Much of those initial gains from the Tuesday night spike have been clawed back, however, keeping at the forefront the issue of timing the topside move in Gold prices.
Gold Price Daily Chart

Chart prepared by James Stanley; Gold on Tradingview
Gold Prices and the Benefit of Confluent Crosswinds
Coming into the year, I had looked at the topside of Gold as one of the top trade ideas for this year. But much of that drive emanated from the premise of softer monetary backdrops as Central Banks continued prodding lower rates with more passive policy and, in some cases, even a re-introduction or a continuation of QE. This is very similar to last year’s push point as Gold prices remained with a bullish backdrop for much of the year, taking corrective breaks from February-May and again from September to mid-December.
Technical Forecast for Gold: Bullish
The fact that prices rushed higher as fear of escalation in Middle East tensions contributed to that move just further highlights another item of importance in the matter: Fear. As tensions calmed in the days following the Iranian missile strike, Gold prices calmed and pulled back to the 1540 area. Buyers responded on Friday as a dose of USD-weakness re-entered the picture following a disappointing NFP report; but the challenge around timing remains.
| Change in | Longs | Shorts | OI |
| Daily | 1% | -3% | -1% |
| Weekly | 2% | -8% | -2% |
Gold Price Hourly Chart: Fear Spike (in Blue) Dissipation (in Red)
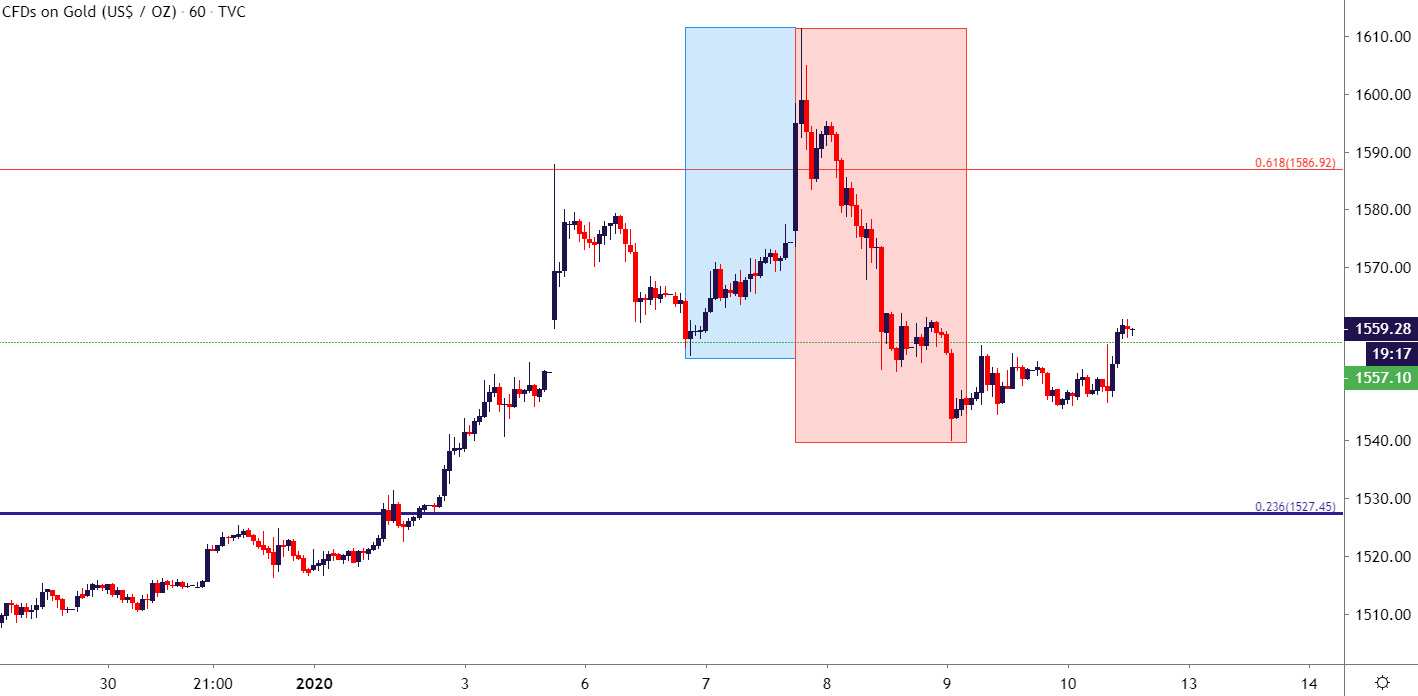
Chart prepared by James Stanley; Gold on Tradingview
Gold Price Strategy Moving Forward:
On the longer-term look, Gold prices still remain in overbought territory, evidenced by the fact that RSI remains above 70 on the Daily chart. While this doesn’t necessarily mean price action has to sell-off or that bulls can’t continue to drive from here, it can be enough to urge caution from chasing the theme on a longer-term basis.
Gold Daily Price Chart
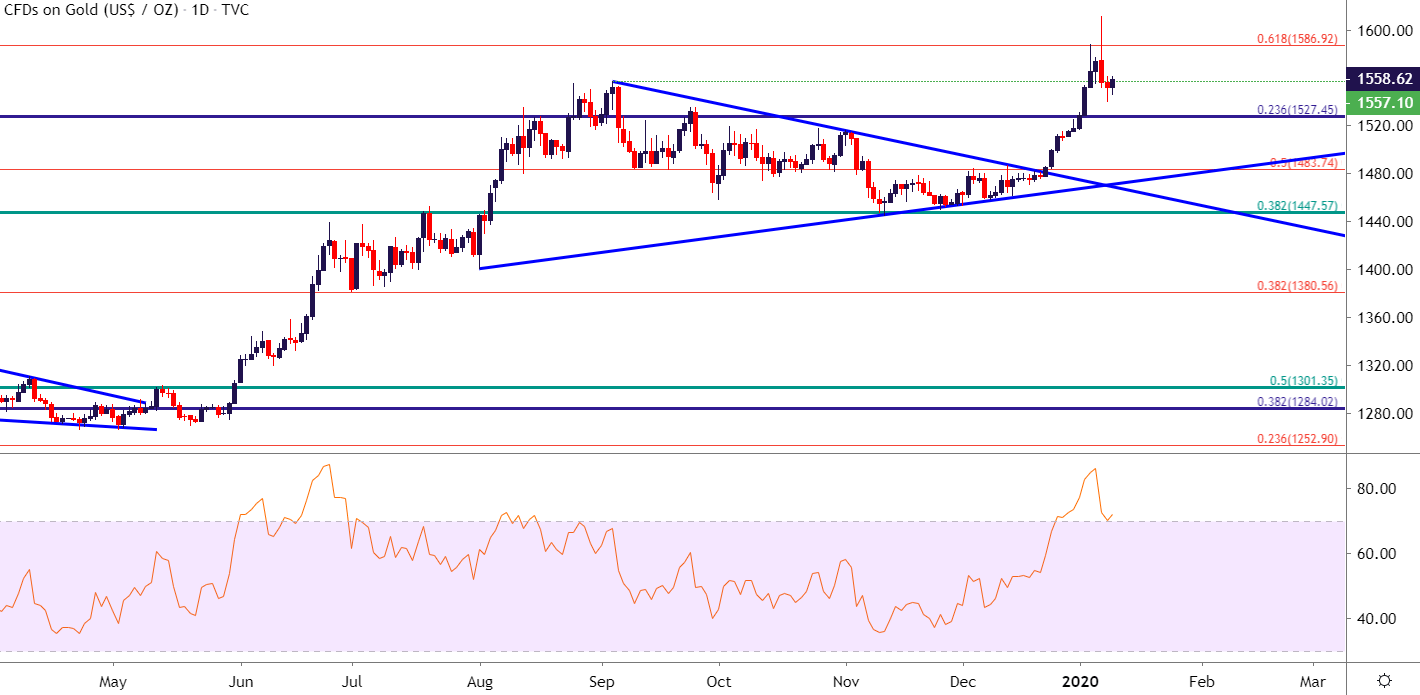
Chart prepared by James Stanley; Gold on Tradingview
On a shorter-term basis, there may be more aggressive manners of working with that bullish theme in Gold. This would require re-utilizing last year’s swing high as a point of potential short-term support. This runs around the 1557 level, and this set the prior six-year-high in the yellow metal in September of last year. More recently, price action in Gold gapped-through that level to open this week, returning down to find support on Monday night.
After sellers pushed Gold prices back-below this level, two short-term observations of resistance played-in; and this was followed by a topside bounce around that NFP report on Friday. A hold here through next week’s open can keep the door open for aggressive bullish strategies on Gold; based on the premise of support showing at prior short-term resistance, coupled with a hold above the Thursday swing-low, indicating continuation potential of that bigger-picture theme of strength.
Gold Hourly Price Chart
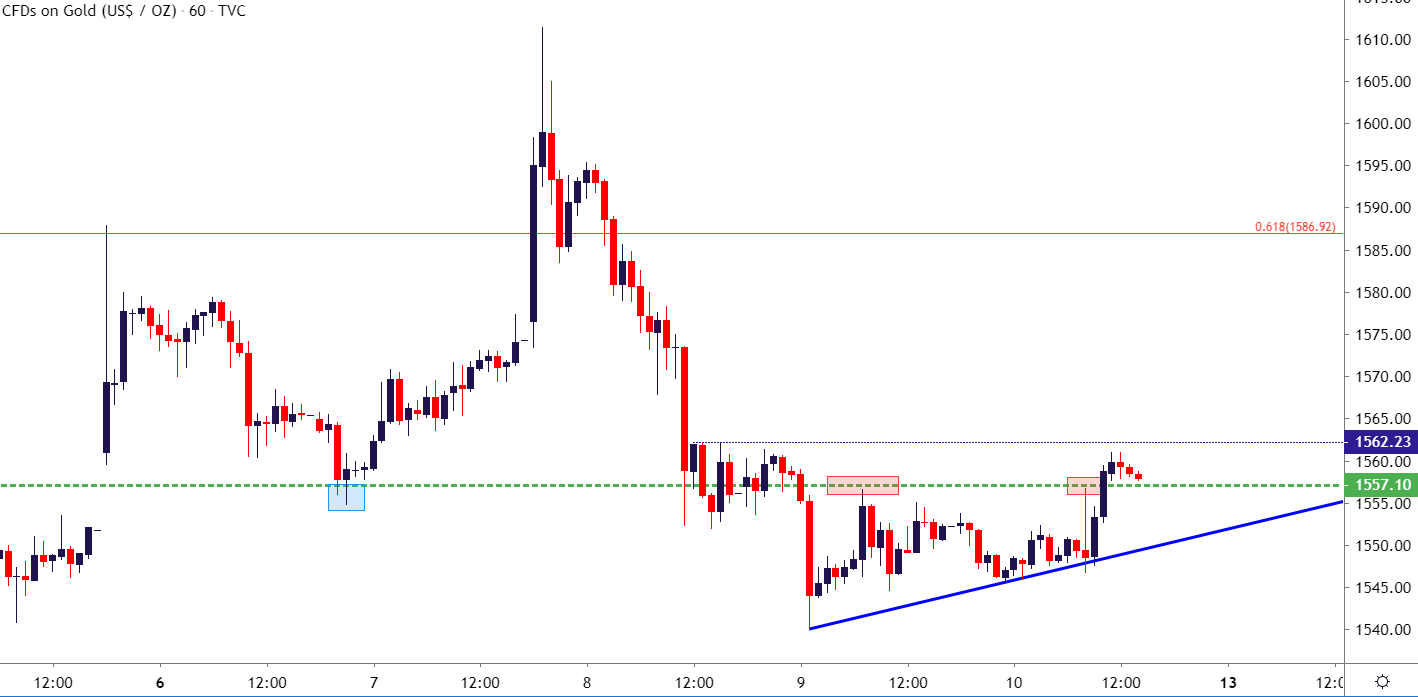
Chart prepared by James Stanley; Gold on Tradingview
--- Written by James Stanley, Strategist for DailyFX.com
Contact and follow James on Twitter: @JStanleyFX


