


Gold Price Technical Highlights:
- Gold reverses extremely hard after trying to break 2011/12 levels
- Daily and very possibly weekly reversal pattern forming
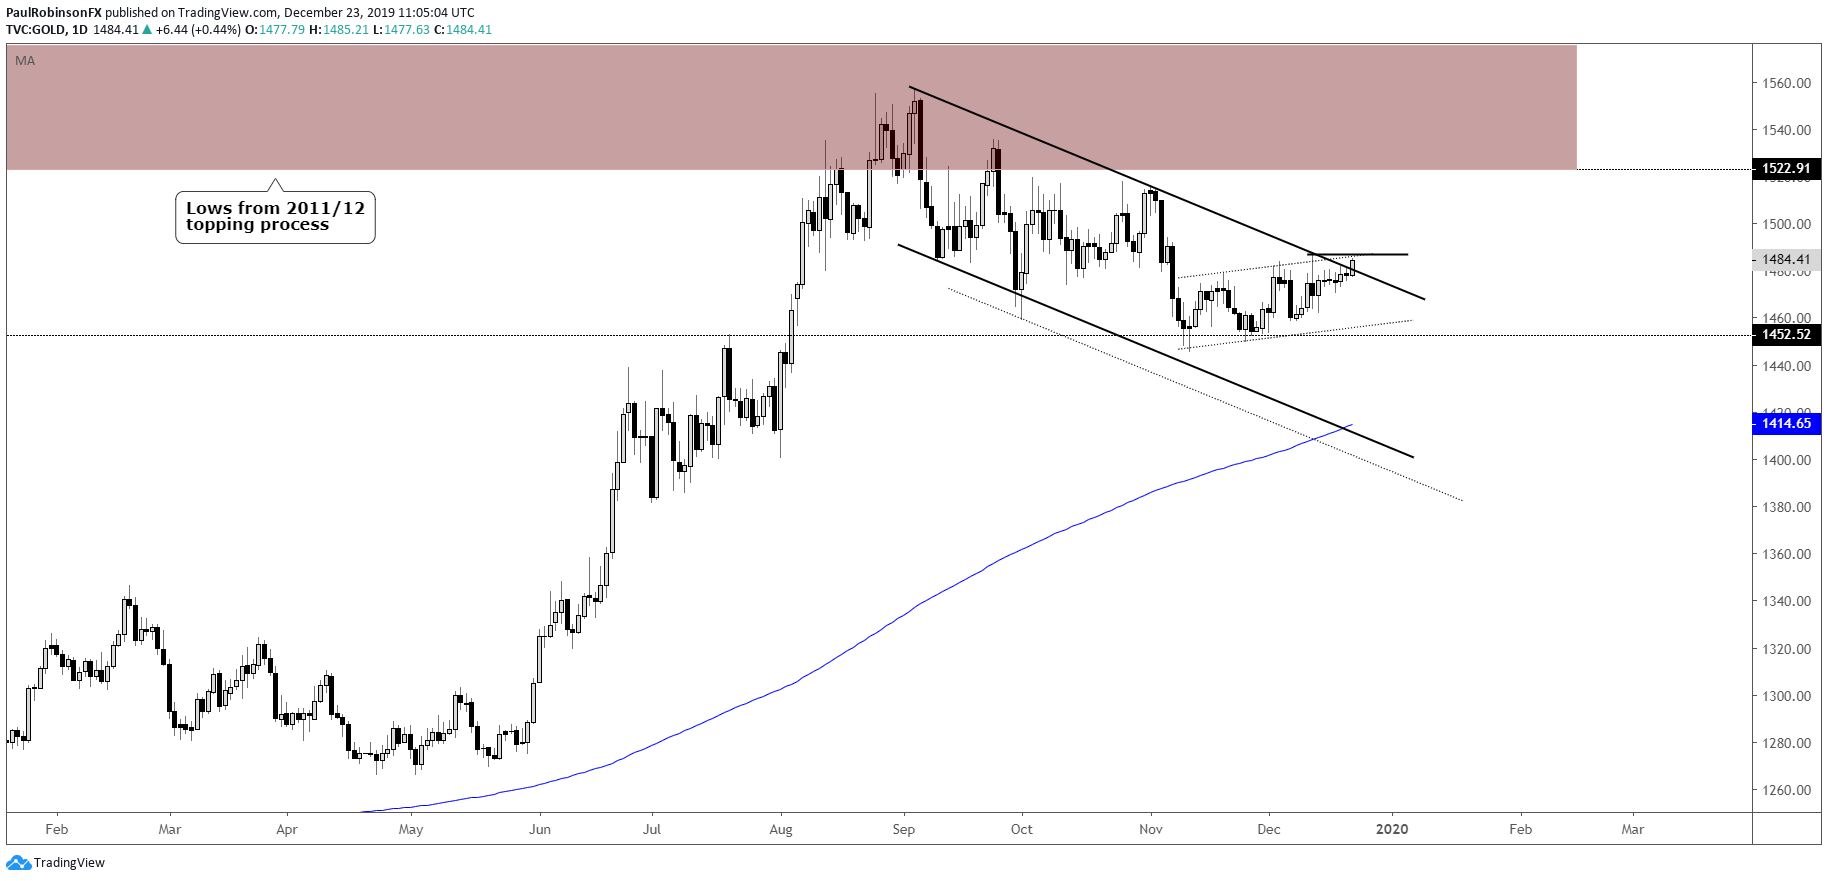
Gold reverses extremely hard after trying to break 2011/12 levels
The sharp reversal in gold on Wednesday carved out, what I like to call them during these dramatic turnabouts, a “death needle”. These are candlesticks highlighted by powerful bearish reversals with long tails (or wicks). In this case the name is perhaps a bit dramatic given that the outlook doesn’t look all that bearish, but nevertheless gold (& silver) look headed lower to sideways at best.
The exhaustion pattern comes following a month-long of solid rallying for gold, and just as it was trying to fully clear on through the lows created during the 2011/12 topping process. The fact such a strong area of resistance is in place makes the placement of the candle even more significant.
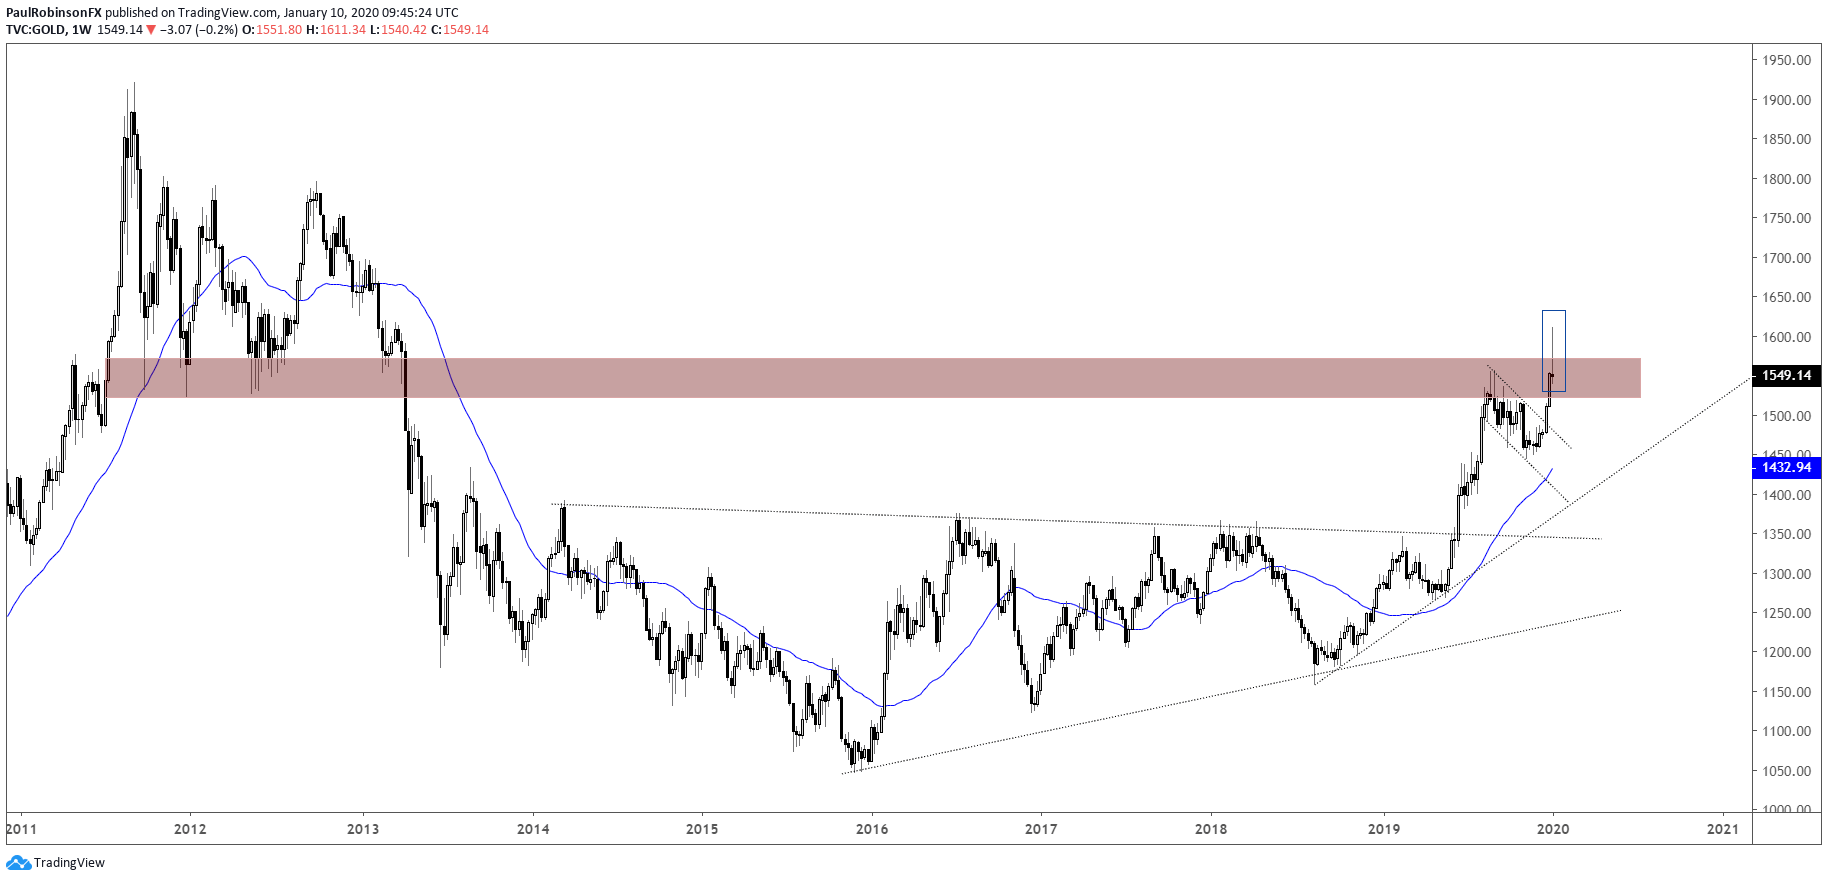
This doesn’t mean gold has topped indefinitely, the outlook coming out of the multi-year wedge in June is still bullish, just not for the immediate time-frame. A period of digestion marked by failed rallies with a bias towards lower prices is seen as the likely outcome in the coming weeks.
Looking for support there aren’t any levels that really stand out. The high from September may help keep things afloat around the 1550 area. Looking a bit lower the trend-line from May could be the line that helps forge a lower during this digestion phase, that could clock in around 1500.
The most aggressive of a decline envisioned from here, without really damaging the chart, is the low from the bull-flag just broken, just south of 1450. But if the upside is to remain intact this lower threshold isn’t seen as coming into play.
Barring a major reversal to the upside today, gold very well could also post a very important reversal on the weekly time-frame. This will help cement the notion of seeing prices lower to sideways at best in the weeks ahead.

Gold Price Daily Chart (looking for some backing-and-filling)
Gold Price Weekly Chart ('death needle' forming)
Gold Price Charts by TradingView
***Updates will be provided on the above technical outlook in webinars held at 1030 GMT on Tuesday and Friday. If you are looking for ideas and feedback on how to improve your overall approach to trading, join me on Thursday each week for the Becoming a Better Trader webinar series.
Resources for Forex & CFD Traders
Whether you are a new or experienced trader, we have several resources available to help you; indicator for tracking trader sentiment, quarterly trading forecasts, analytical and educational webinars held daily, trading guides to help you improve trading performance, and one specifically for those who are new to forex.
---Written by Paul Robinson, Market Analyst
You can follow Paul on Twitter at @PaulRobinsonFX


