


Gold Price Talking Points:
- It was a busy week in Gold as price action went on a turbulent ride, driven by a number of key headline themes such as US-China trade dynamics along with FOMC and ECB rate decisions.
- Gold prices remain in a longer-term bullish pattern, continuing to carry the question of timing the return of that topside theme.

Gold Prices Rip, Then Dip on Headline Flow
It’s been a busy week for the yellow metal and while Gold prices look to close the week with a gain, the price action shown around various drivers can be used to highlight deductive items of interest moving forward. The big item of excitement in Gold prices showed after the FOMC rate decision on Wednesday afternoon. But it was the ECB rate decision the morning after, the first with Christine Lagarde at the helm, that Gold bulls really started to make their mark, pushing prices up to a fresh monthly high after the back-half of November showed considerable consolidation.
But that move didn’t last for long: Sellers soon came back on the heels of a tweet from President Trump, in which optimistic comments around the ongoing US-China trade deal were shared, helping to evoke a risk-on move across a number of equity indices. Even more quickly than Gold prices had initially rallied, sellers erased the entirety of those post-FOMC and ECB gains.
Gold Four Hour Price Chart
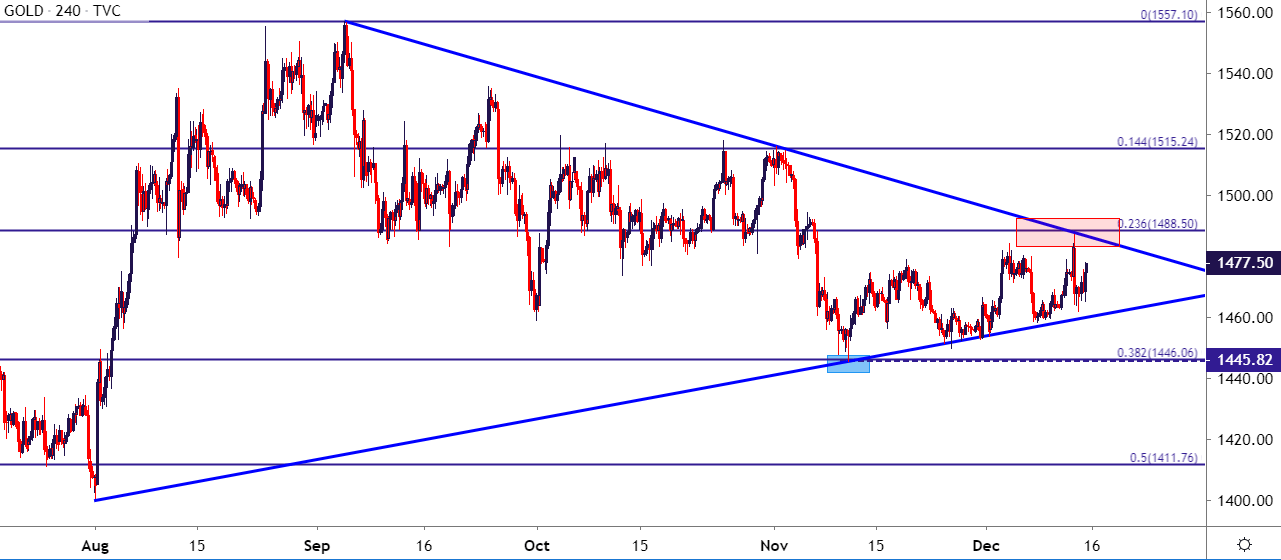
Chart prepared by James Stanley; Gold on Tradingview
Gold Price: The Big Picture
On a longer-term basis the trend is fairly clear. The year of 2019 has been a big one for Gold bulls as the yellow metal came into the year with strength and showed a significant breakout that held during a four-month-stretch over the summer. Prices volleyed from sub-1280 to above 1550 from late-May to early-September; and this is similar to the prior breakout that ran from August of 2018 into February of this year. After that move, prices digested for three months from February into May as a falling wedge had formed. For the most recent breakout, prices began to digest after a fresh six-year-high was set in September but, to date, the long-term bullish move appears to remain on pause.
There’s a variety of interesting levels in this theme: The five-month-low in Gold prices comes in right around the 38.2% retracement of the summer breakout, helping to keep continuation prospects in-tact for the bullish trend. An upward-sloping trendline has built from swing-lows in August and November and, so far, buyers have held that projection after re-tests in late-November and early-December.
The complication, however, is one of timing: When will the short-term motivation from bulls take-over to continue the longer-term bullish trend? The answer to this is likely contained around Central Banks and their drives in 2020; similar to the short-term observation that was seen around the FOMC and ECB earlier this week.
Gold Daily Price Chart
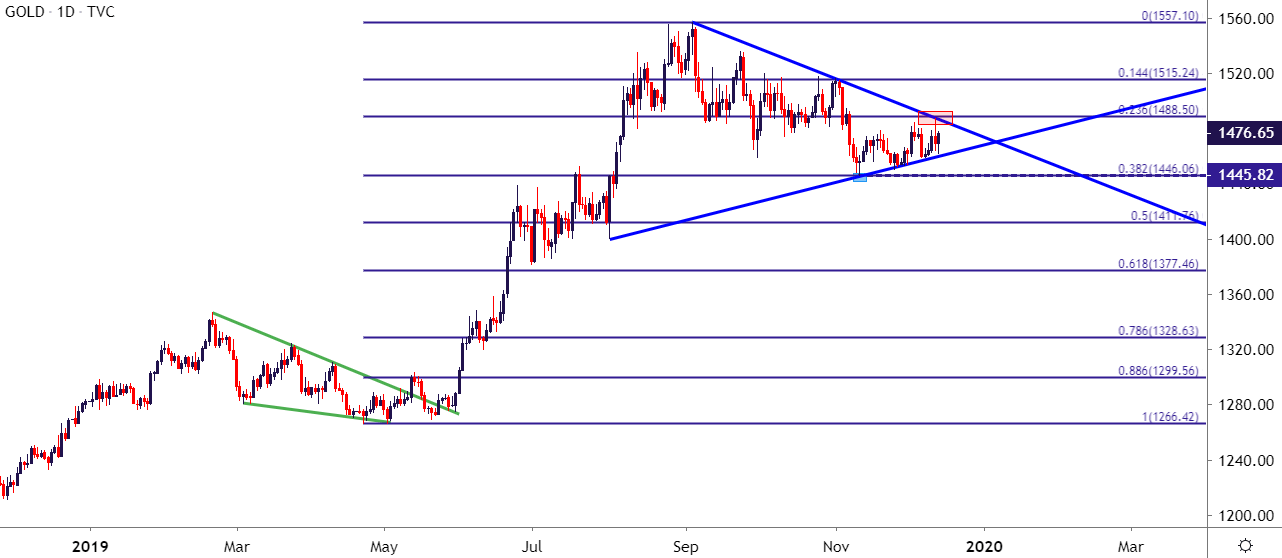
Chart prepared by James Stanley; Gold on Tradingview
Why Did Gold Fold Around US-China Trade Hopes?
This was a question in the Thursday webinar and it’s worth exploring here given that the impact of that optimism around US-China amounted to a fast and forceful bearish move in Gold. This is likely owed to the context from the FOMC rate decision the day before: At that meeting, Jerome Powell framed the Fed’s stance as one not looking to hike rates unless there was a ‘really significant’ rise in inflation, echoing his comments from the bank’s third 2019 rate cut in October. Continued lack of progress on the US-China front ahead of the 2020 election could put even more pressure on growth and, in-turn, inflation in the US, which would allow the Fed to stay loose and passive through the bulk of next year.
But a quick glimmer of hope on the trade front brought to question that scenario, leading to the potential for a better-than-expected backdrop of growth and inflation that may threaten that dovish and passive posture communicated by the Fed just a day earlier. So, this likely has more to do with expectations around major Central Banks to go along with growth/inflation projections rather than a direct response to US-China trade dynamics. This can also help to keep the focus on the long side of Gold even as positive developments show in the ongoing trade rift between the two largest national economies in the world. The technical forecast will be set to bullish on Gold.
Technical Forecast for Gold: Bullish
| Change in | Longs | Shorts | OI |
| Daily | 1% | -3% | -1% |
| Weekly | 2% | -8% | -2% |
Gold Price Four-Hour Chart

Chart prepared by James Stanley; Gold on Tradingview
--- Written by James Stanley, Strategist for DailyFX.com
Contact and follow James on Twitter: @JStanleyFX


