


Gold Price Forecast Overview:
- Gold prices got a lift after the December Fed meeting, with Fed Chair Powell saying that interest rates are likely to remain on hold for quite some time.
- Gold prices were unable to clear 1487.50, suggesting that the downtrend from the September and November highs will remain intact.
- According to the IG Client Sentiment Index, gold prices continue to have a sideways trading bias.
Looking for longer-term forecasts on Gold and Silver prices? Check out the DailyFX Trading Guides.
Forex Economic Calendar Looms Large
Gold prices got a lift after the December Fed meeting, with Fed Chair Powell saying that interest rates are likely to remain on hold for quite some time. An environment defined by an ardently neutral Federal Reserve leaves open the possibility for inflation to overshoot for a period of time, increasing one important aspect of gold’s appeal: precious metals tend to do well when real interest rates fall.
However, the good news for gold prices was short lived. Today, reports of progress on the US-China trade war front have sapped demand for safe haven assets, including gold prices. As a result, the downtrend in gold prices from the September and November highs remains intact.
Gold Volatility Stays Depressed
Precious metals like gold have a relationship with volatility unlike other asset classes. While other asset classes like bonds and stocks don’t like increased volatility – signaling greater uncertainty around cash flows, dividends, coupon payments, etc. – precious metals tend to benefit during periods of higher volatility. Heightened uncertainty in financial markets due to increasing macroeconomic tensions (like US-China trade) increases the safe haven appeal of gold. On the other hand, decreased volatility tends to harm gold prices.
GVZ (Gold Volatility) Technical Analysis: Daily Price Chart (December 2016 to December 2019) (Chart 1)
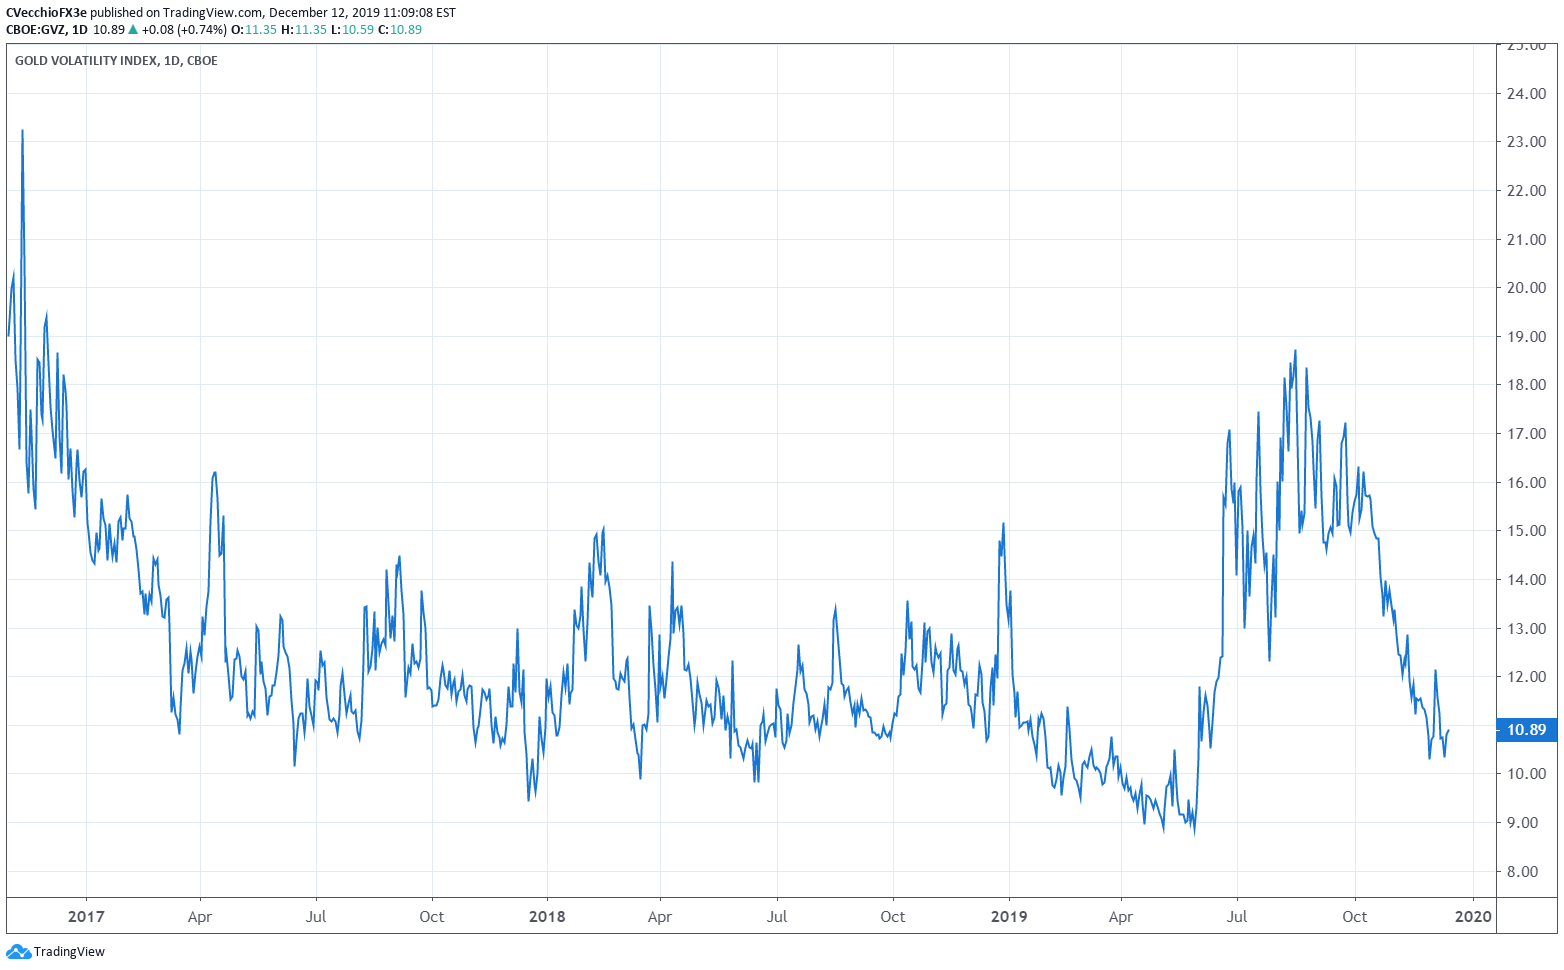
Gold volatility (as measured by the Cboe’s gold volatility ETF, GVZ, which tracks the 1-month implied volatility of gold as derived from the GLD option chain) was trading at 10.89; in our last update on gold volatility, GVZ was trading at 10.83. As it were, gold volatility has moved sideways for nearly the past five weeks, having closed every session since November 12 between 10.30 and 12.15.
As both gold prices and gold volatility have moved sideways in recent weeks, we’ve seen the relatively longer-term correlation increase: the 5-day correlation between GVZ and gold prices is 0.30 while the 20-day correlation is 0.68; in the prior gold volatility update, the 5-day correlation was 0.96 and the 20-day correlation was 0.58.
Gold Price Technical Analysis: Daily Chart - Descending Channel (December 2018 to December 2019) (Chart 2)
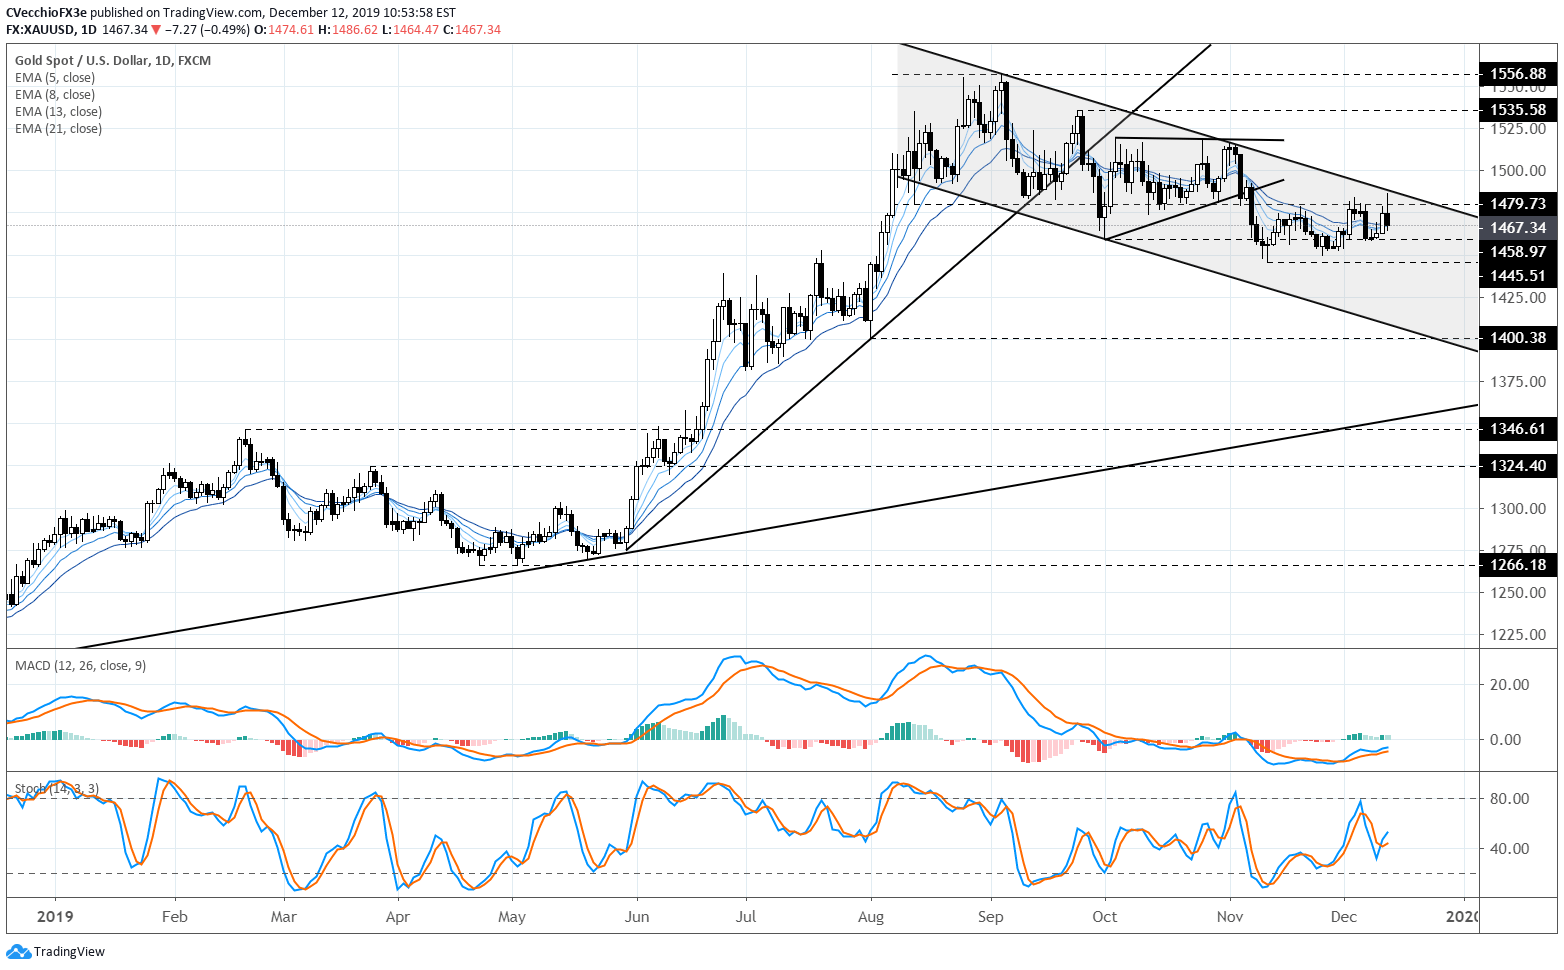
In this week’s earlier gold price forecast, the outlook noted that “a bullish outlook for gold prices would only be valid if the descending channel from the September and November highs breaks, which would occur above 1487.50 by the end of this week.” In the immediate aftermath of the December Fed meeting, gold prices were able to rally to 1486.62 – but no higher.
As a result, the descending channel from the September and November highs continues to hold, and the most recent rally failed to breach downtrend resistance. It’s still not appropriate to take a bullish outlook on gold prices.
For now, gold prices remain intermingled among the daily 5-, 8-, 13-, and 21-EMA envelope, which is in neither bearish nor bullish sequential order. Daily MACD is trending higher, still in bearish territory, while Slow Stochastics are straddling their median line.
Given the reversal in gold prices, it still holds that “a move down below 1458.97 increases the odds of a return to the November low at 1445.51.” But between 1458.97 and 1487.50, traders may find themselves extremely frustrated.
Gold Price Technical Analysis: Weekly Chart – Inverse Head and Shoulders Pattern (July 2011 to December 2019) (Chart 3)
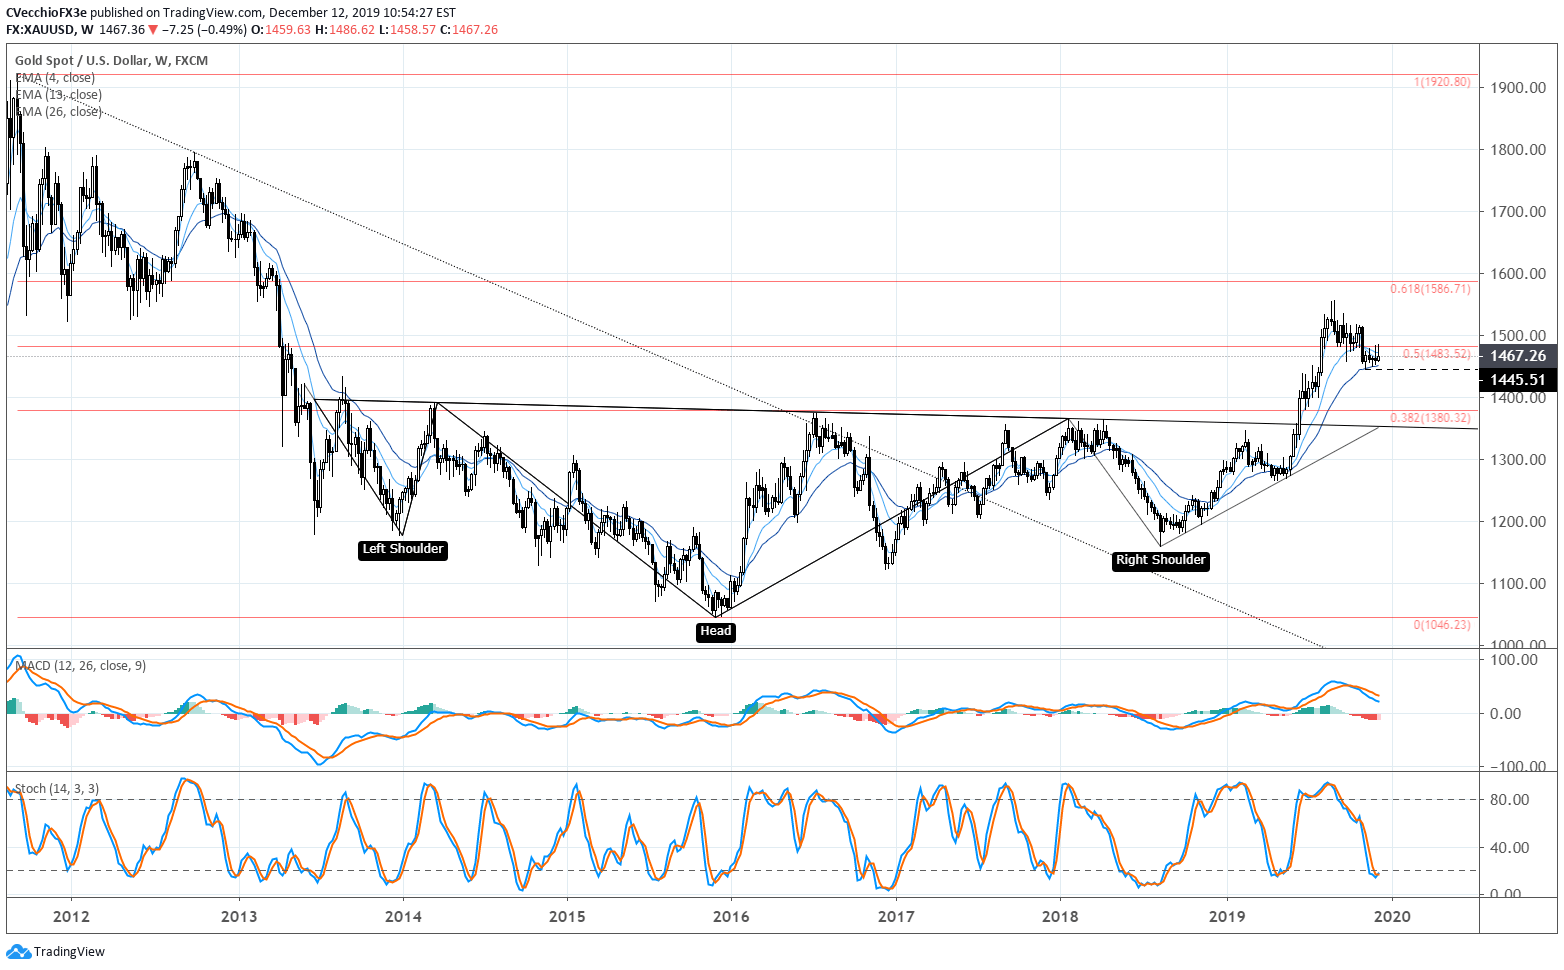
The weekly timeframe continues to move at a snail’s pace, and there is no change since the last gold price forecast update. The gold price pullback since the October Fed meeting must be viewed in context of the longer-term technical picture: the gold price inverse head and shoulders pattern that originated earlier this year is still valid.
Depending upon the placement of the neckline, the final upside targets in a potential long-term gold price rally vary: conservatively, drawing the neckline breakout against the January 2018 high at 1365.95 calls for a final target at 1685.67; aggressively, drawing the neckline breakout against the August 2013 high at 1433.61 calls for a final target at 1820.99.
Only a break below the August 1 bullish outside engulfing bar low at 1400.38 would draw into question the longer-term bullish potential for gold prices. It’s worth noting that the weekly 26-EMA – the six-month average – has held up as support on a closing basis since gold prices first returned to it during the second week of November 2019; a break below here could be an ominous signal.
IG Client Sentiment Index: Gold Price Forecast (December 12, 2019) (Chart 4)

Gold: Retail trader data shows 71.71% of traders are net-long with the ratio of traders long to short at 2.53 to 1. The number of traders net-long is 7.96% lower than yesterday and 1.58% lower from last week, while the number of traders net-short is 15.53% higher than yesterday and 1.63% lower from last week.
We typically take a contrarian view to crowd sentiment, and the fact traders are net-long suggests Gold prices may continue to fall. Positioning is less net-long than yesterday but more net-long from last week. The combination of current sentiment and recent changes gives us a further mixed Gold trading bias.
FX TRADING RESOURCES
Whether you are a new or experienced trader, DailyFX has multiple resources available to help you: an indicator for monitoring trader sentiment; quarterly trading forecasts; analytical and educational webinars held daily; trading guides to help you improve trading performance, and even one for those who are new to FX trading.
--- Written by Christopher Vecchio, CFA, Senior Currency Strategist
To contact Christopher Vecchio, e-mail at cvecchio@dailyfx.com
Follow him on Twitter at @CVecchioFX
View our long-term forecasts with the DailyFX Trading Guides


