IG Client Sentiment
View current trader sentiment and discover who is going long and short, the percentage change over time, and whether market signals are bullish or bearish.
View More

Show Change in Position
Symbol
Signal
Net Long
Net Short
Change in
Longs
Shorts
OI
EUR/USD
Bearish
Daily change in
Longs
-1%
Shorts
-4%
OI
-3%
Weekly change in
Longs
4%
Shorts
-10%
OI
-5%

EUR/GBP
Bullish
Daily change in
Longs
-4%
Shorts
-2%
OI
-4%
Weekly change in
Longs
-9%
Shorts
5%
OI
-6%

NZD/USD
Bearish
Daily change in
Longs
6%
Shorts
-13%
OI
2%
Weekly change in
Longs
40%
Shorts
-35%
OI
15%
AUD/JPY
Mixed
Daily change in
Longs
0%
Shorts
11%
OI
5%
Weekly change in
Longs
29%
Shorts
-25%
OI
-3%

EUR/CHF
Bearish
Daily change in
Longs
0%
Shorts
-11%
OI
-3%
Weekly change in
Longs
2%
Shorts
-20%
OI
-5%
EUR/JPY
Mixed
Daily change in
Longs
-9%
Shorts
0%
OI
-3%
Weekly change in
Longs
17%
Shorts
-22%
OI
-11%

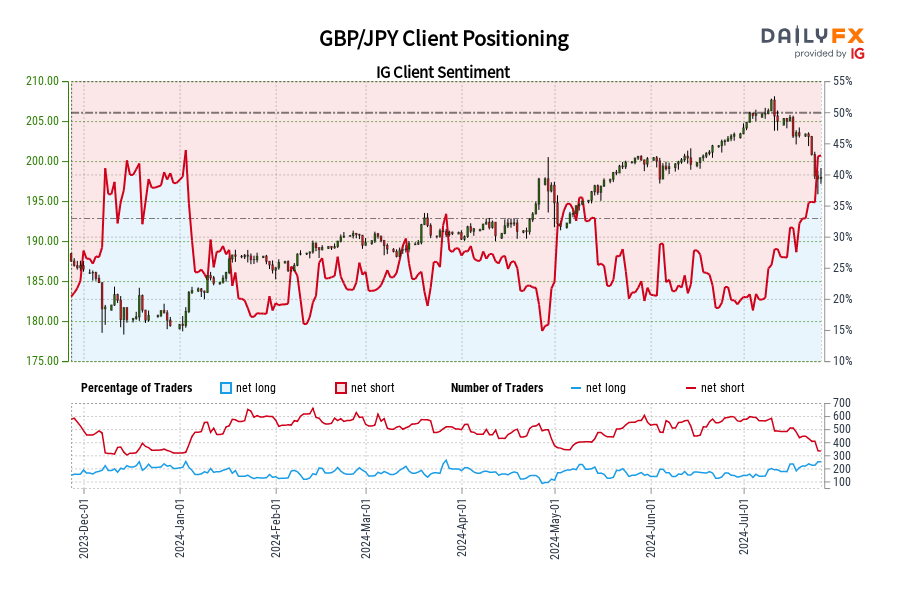
GBP/JPY
Bearish
Daily change in
Longs
1%
Shorts
-3%
OI
-1%
Weekly change in
Longs
13%
Shorts
-31%
OI
-17%
USD/CAD
Bullish
Daily change in
Longs
-2%
Shorts
7%
OI
5%
Weekly change in
Longs
-30%
Shorts
38%
OI
13%
GBP/USD
Bearish
Daily change in
Longs
3%
Shorts
-7%
OI
-3%
Weekly change in
Longs
4%
Shorts
-10%
OI
-5%
USD/JPY
Mixed
Daily change in
Longs
-2%
Shorts
2%
OI
0%
Weekly change in
Longs
12%
Shorts
-16%
OI
-6%
Oil - US Crude
Bearish
Daily change in
Longs
3%
Shorts
-7%
OI
1%
Weekly change in
Longs
31%
Shorts
-38%
OI
7%

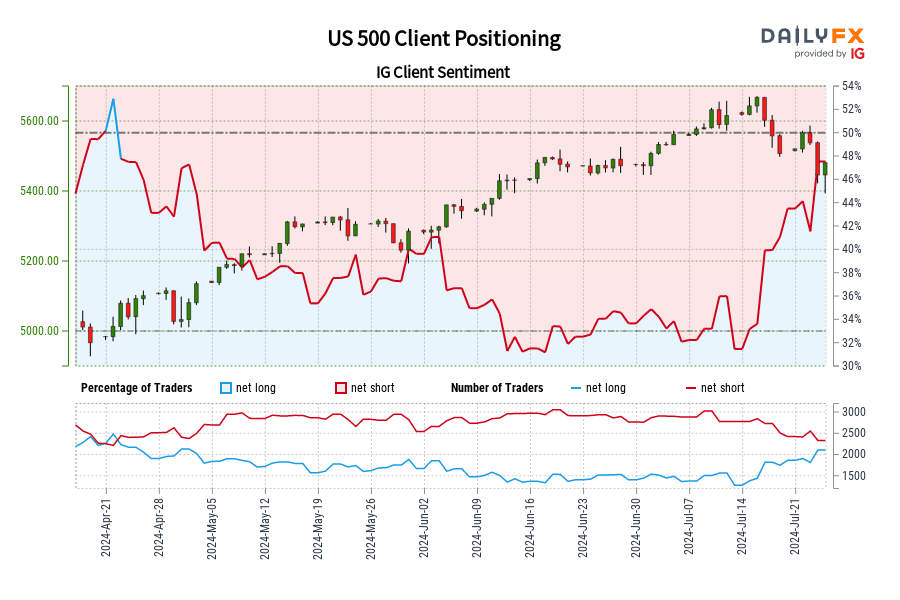
US 500
Bearish
Daily change in
Longs
1%
Shorts
-1%
OI
0%
Weekly change in
Longs
15%
Shorts
-13%
OI
-1%
Wall Street
Bullish
Daily change in
Longs
-18%
Shorts
18%
OI
7%
Weekly change in
Longs
-19%
Shorts
14%
OI
4%
Germany 40
Bullish
Daily change in
Longs
-9%
Shorts
7%
OI
2%
Weekly change in
Longs
-27%
Shorts
9%
OI
-5%

FTSE 100
Bullish
Daily change in
Longs
-30%
Shorts
25%
OI
2%
Weekly change in
Longs
-44%
Shorts
44%
OI
0%
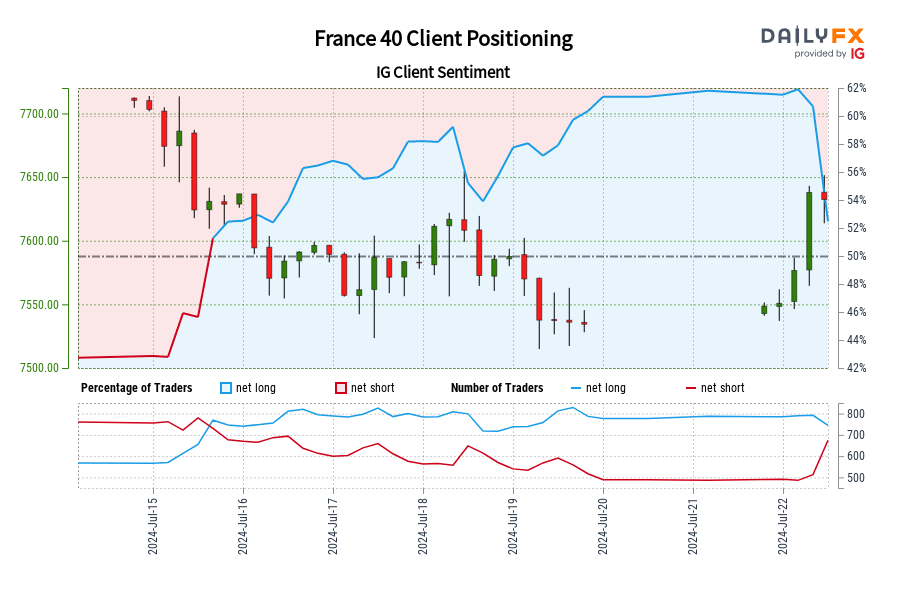
France 40
Bullish
Daily change in
Longs
-12%
Shorts
26%
OI
1%
Weekly change in
Longs
-8%
Shorts
4%
OI
-3%
Order By
Market
Signal
Net Long percentage
Net Short percentage
Change in Longs
Change in Shorts
Change in Open Interest
Advertisement
Advertisement