


US Dollar Talking Points:
- I had looked at a budding breakout in the US Dollar Price Action Setups article yesterday, which was an extension of an earlier-week breakout from a longer-term bull flag formation in the currency.
- EUR/USD is still moving down towards parity but the big moves overnight were in GBP/USD and USD/JPY. I had warned on each yesterday, highlighting GBP/USD breakdown potential to go alongside an ascending triangle in USD/JPY, which has broken out to the resistance highlighted at the 137.00 level.
- Next week brings the Jackson Hole Economic Symposium and the bullish trend in the US Dollar has come screaming back this week after spending about a month in a bearish channel to make up that bull flag formation, highlighted in this week’s technical forecast.
- The analysis contained in article relies on price action and chart formations. To learn more about price action or chart patterns, check out our DailyFX Education section.

The US Dollar is back to its bullish ways. And now that question that I highlighted in the technical forecast to begin this week no longer looks so clear. That question was ‘has the US Dollar topped,’ and while the top-callers were out in full bloom last week and the week before, they’ve seemingly been silenced after an aggressive top-side trend has developed in the US Dollar.
And there’s been contribution from a number of other currencies. EUR/USD continues to snake-lower towards support at the parity psychological level. But the big bang overnight has been elsewhere, with GBP/USD plummeting to a fresh low as USD/JPY posed an aggressive top-side breakout. AUD/USD has tripped down to another big level of support after failing to hold at the .7000 handle earlier in the week, and USD/CAD is now at a major zone of longer-term resistance after a strong USD thrust in that pair.
US Dollar
I want to keep this one somewhat clean so I’m going to go with the daily chart here. Last week’s pullback found support at the 23.6% Fibonacci retracement which was confluent with both prior price action resistance and the 105.00 psychological level. The prior bearish channel, when meshed with the previous bullish trend, made for a bull flag formation. And that was the focus in this week’s technical forecast. Last Thursday printed as a spinning top, similar to a doji in that it highlights indecision, and Friday posted a gain. Collectively, last Wednesday through Thursday made for a morning star formation, which continued with bullish price trends through this week.
The challenge with bullish strategies now is how far away price is from recent support. But, there are prior areas of resistance that can be repurposed for higher-low support potential, taken from the same 107.40-107.47 zone that I looked at yesterday as resistance, or the 106.93 zone that I looked at on Tuesday.
US Dollar Daily Price Chart
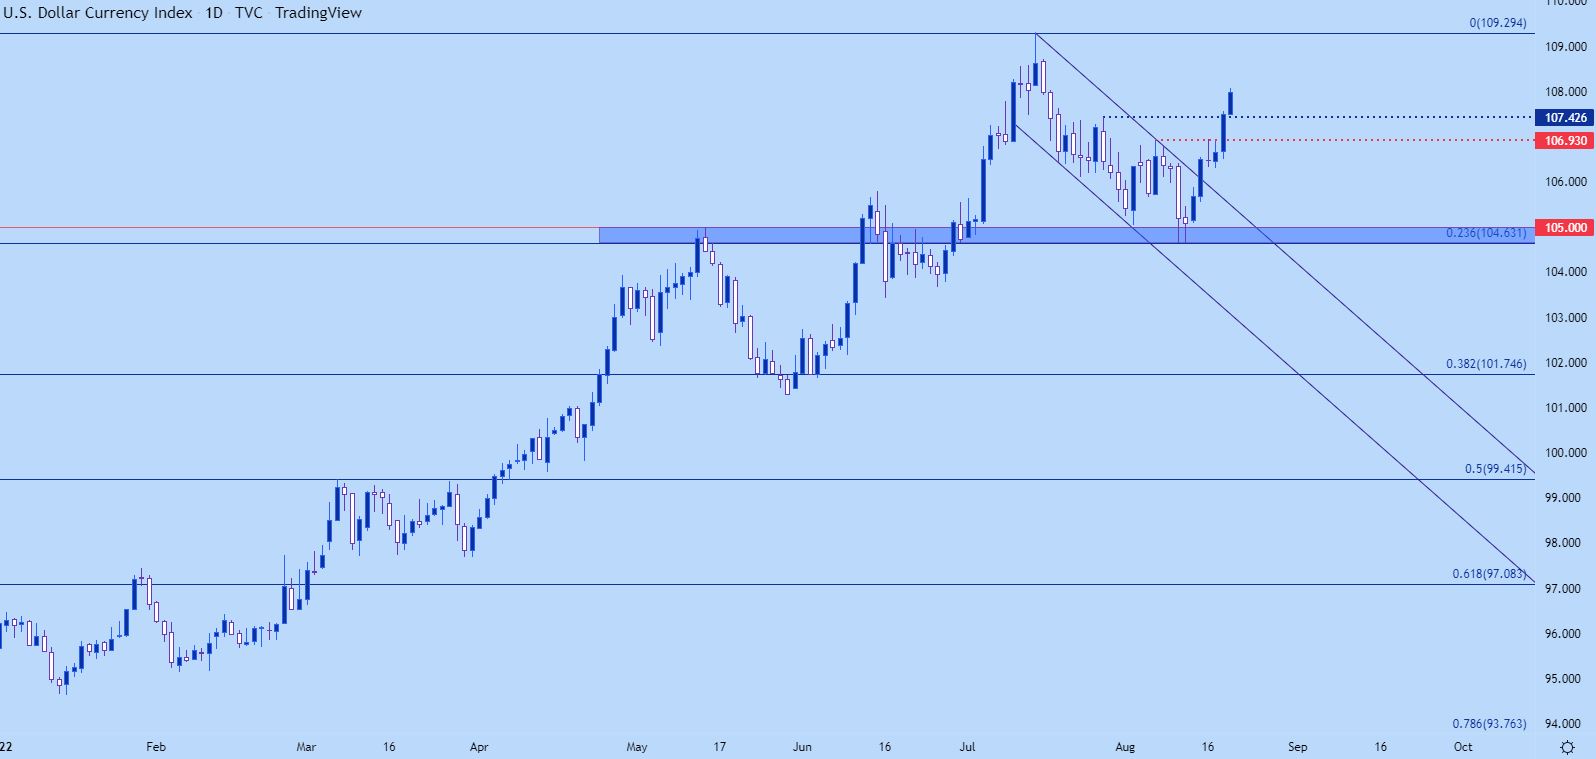
Chart prepared by James Stanley; USD, DXY on Tradingview
EUR/USD
So, the big question here also relates to breakout continuation potential in the USD above…
Are we at a place where EUR/USD can pose that sustained break-below parity? I’m not entirely sure that sentiment will yet allow for it. To be sure, there’s little by way of positivity around the Euro at the moment. I wouldn’t have any attraction whatsoever to the fundamental side of the matter.
My quandary would be more positioning-based, as I’ve been noting, given how prolonged the sell-off has been. A move of that nature, especially in a market as large as EUR/USD, means a large net short stance. So if EUR/USD does push below parity again – is there enough money on the sidelines to come in and keep knocking it lower?
This is why price action trends normally take that one step forward – two steps back type of logic. As shorts take profit, demand increases, bumping prices higher, and if the market is still weak, sellers will react at lower-highs, thereby continuing the sequence. When that doesn’t happen – or when price makes 35 steps down in then one back, you have to be somewhat cautious and that’s kind of the scenario that it feels like we’re working with in EUR/USD at the moment.
Is it possible that sellers go for the jugular here? Sure, Europe is in a real bad spot fundamentally speaking. But the big question is how aggressive will sellers be on a print starting with a .99 v/s a 1.00 and that’s a bit more difficult to work with. When EUR/USD was breaking above parity in 2002 it took six months, even with a persistent effort from buyers.
We did get one flare up to a key point of resistance that I was looking for. So, the possibility of breakdown does exist – there were certainly some long-term shorts washed out on that breakout last week on CPI data. But, I still have the question to whether or not there’s going to be enough drive below parity to allow for that continued sustained breakdown at this specific point in time.
EUR/USD Daily Price Chart
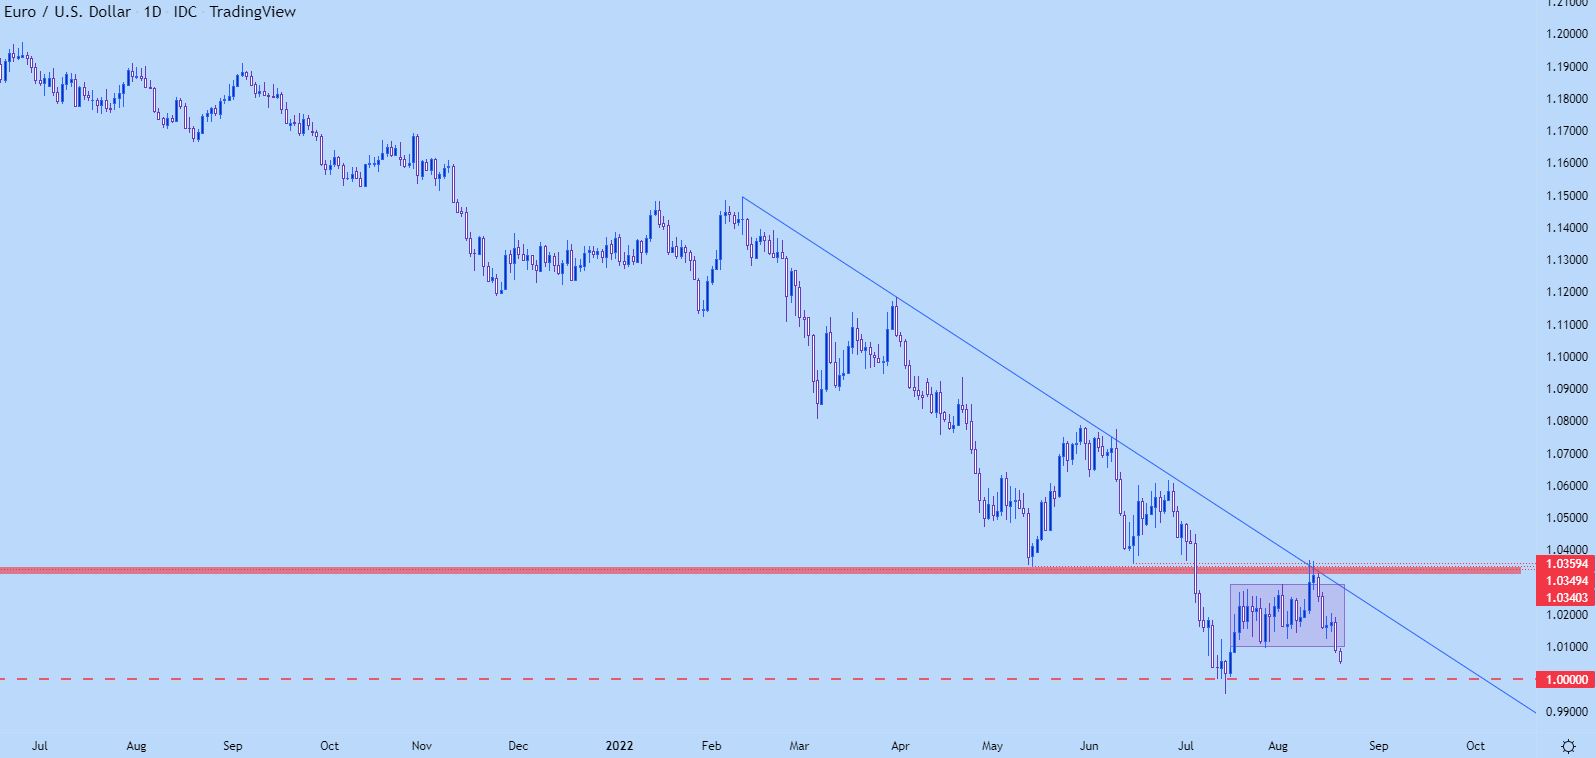
Chart prepared by James Stanley; EURUSD on Tradingview
GBP/USD
Helping to push that USD breakout has been a strong breakdown in GBP/USD.
I had warned of this in yesterday’s installment of US Dollar Price Action Setups, saying “Cable looks like its setting up for breakdown potential to my eyes.”
It was the 1.2000-1.2021 zone that caught my attention. This was an area that I’ve been talking about for months for various purposes. It did so when I was working with a falling wedge formation in the pair last month. That formation then led to a reversal and then a breakout. But, it couldn’t get up for a resistance test and instead started to show symptoms of a breakdown.
On Tuesday, that zone was back in-play for another bounce. But, the bounce was even less than what had happened from the prior test. What caught my eye yesterday: Candlestick wicks were digging a bit deeper into support with each iteration. This showed me that support was starting to give way and when coupled with progressively lower-highs, it seemed as though bulls were losing steam. And that very much has turned out to be the case.
As for continuation potential – we’re nearing a big zone of support potential around a prior swing-low.
GBP/USD Daily Chart
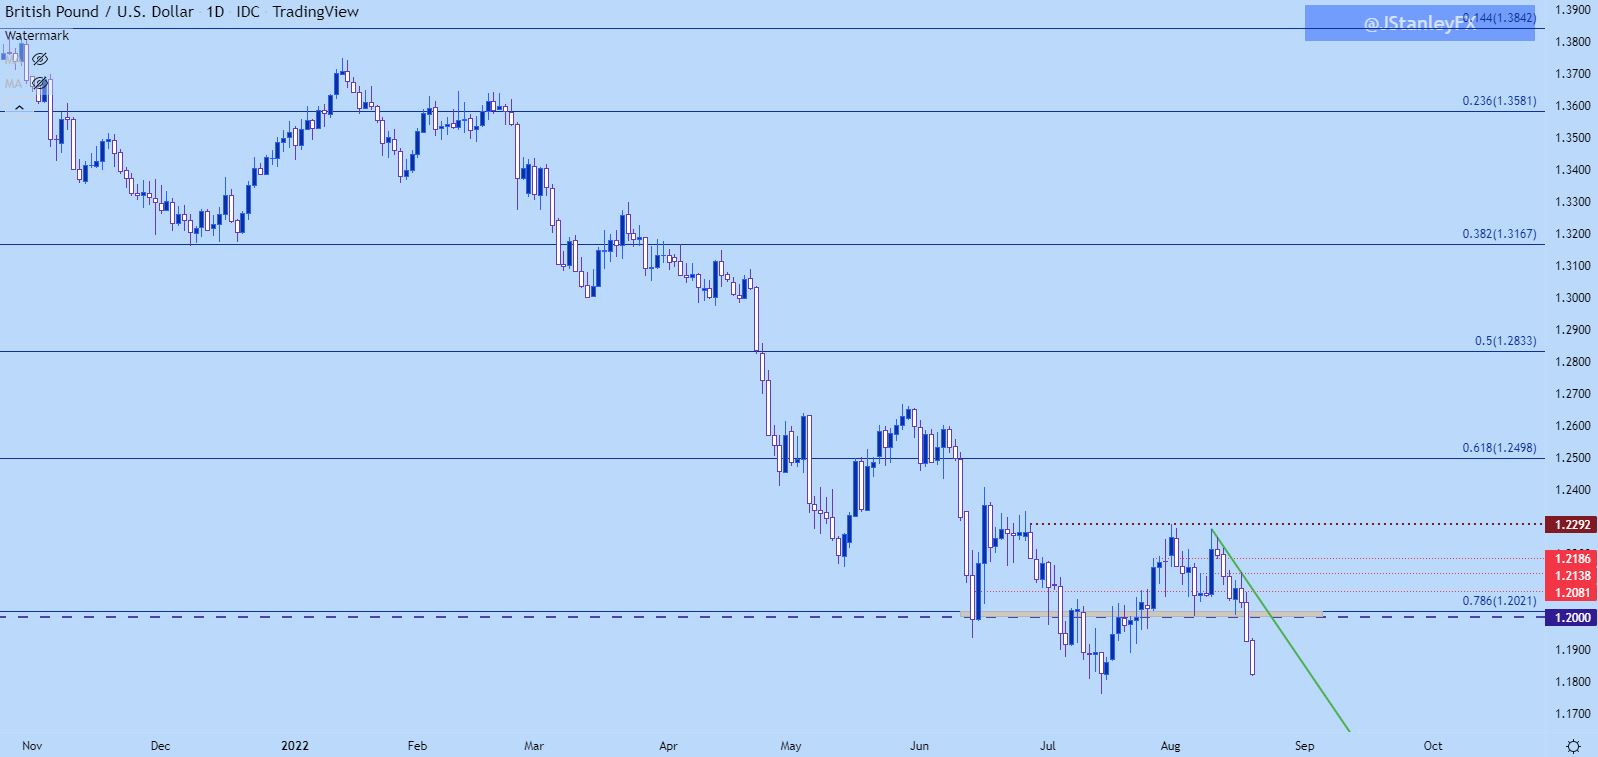
Chart prepared by James Stanley; GBPUSD on Tradingview
USD/CAD
If looking to fade off USD-strength, USD/CAD may be of interest. As I mentioned yesterday the short-term setup did not seem very clear to me. Instead, I was focusing on longer-term zones of relevance, with resistance around the 1.3000 psychological level.
This run of USD-strength has propelled the pair up to that zone and there hasn’t been a daily close above 1.3025 since November of last year. The longer-term bear flag remains in-play.
USD/CAD Weekly Chart
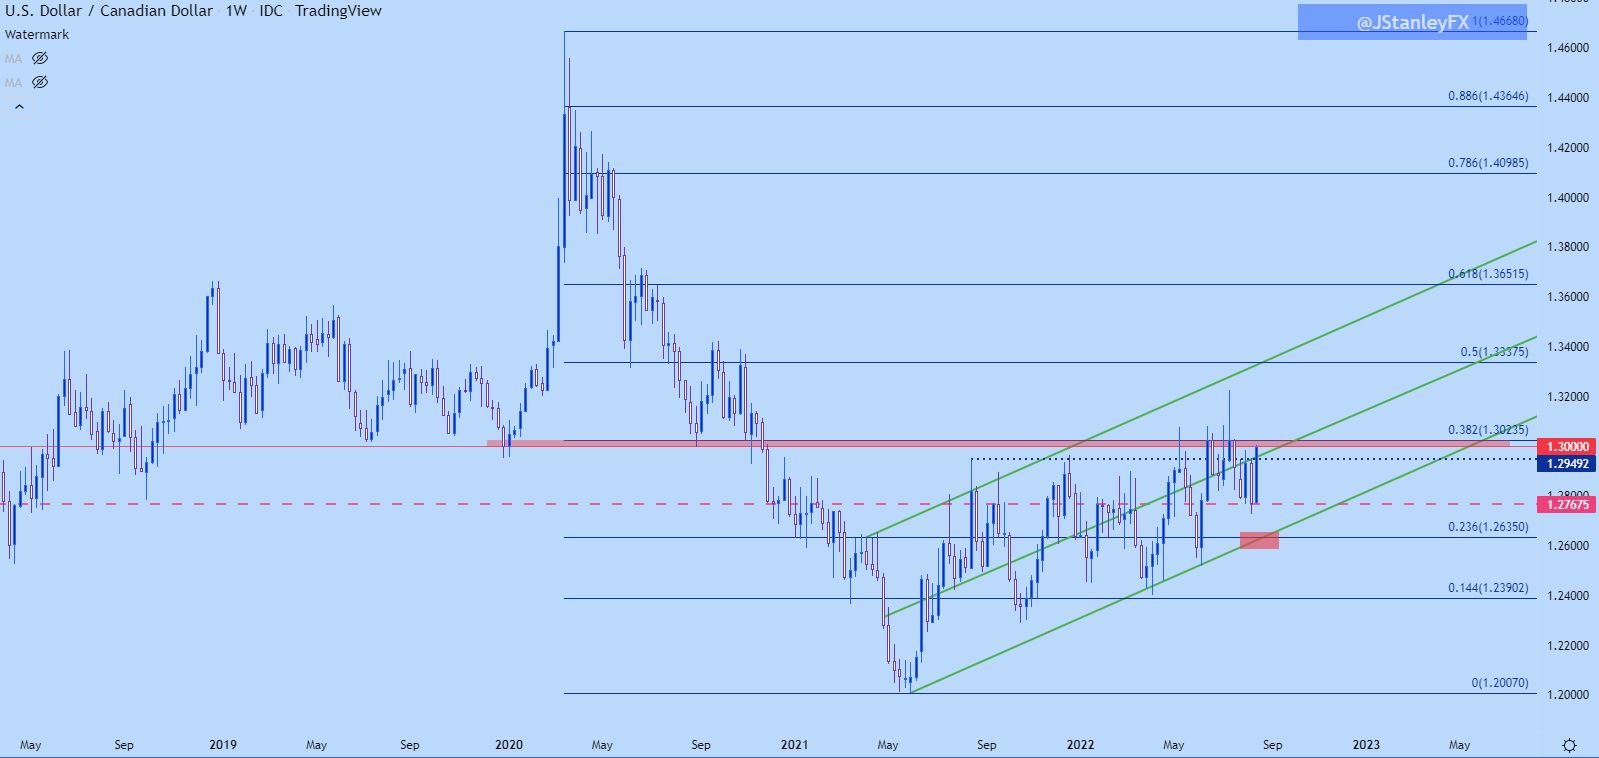
Chart prepared by James Stanley; USDCAD on Tradingview
USD/JPY
USD/JPY had an interesting week.
Coming into the week the pair seemed somewhat trend-less to me. But, by Tuesday some potential began to show, and I highlighted a bullish bias in the US Dollar Price Action Setups article then. Two days later, an ascending triangle had formed and bullish breakout potential was brewing.
I highlighted that yesterday along with my next resistance level up at 137.00. That’s already come into play and as of this writing that’s what’s helping to set the high. There could be another spot of resistance around the 107.50 psychological level. Chasing here could be a challenge and higher-low support potential exists around the price action swing around 136.36.
USD/JPY Four-Hour Price Chart
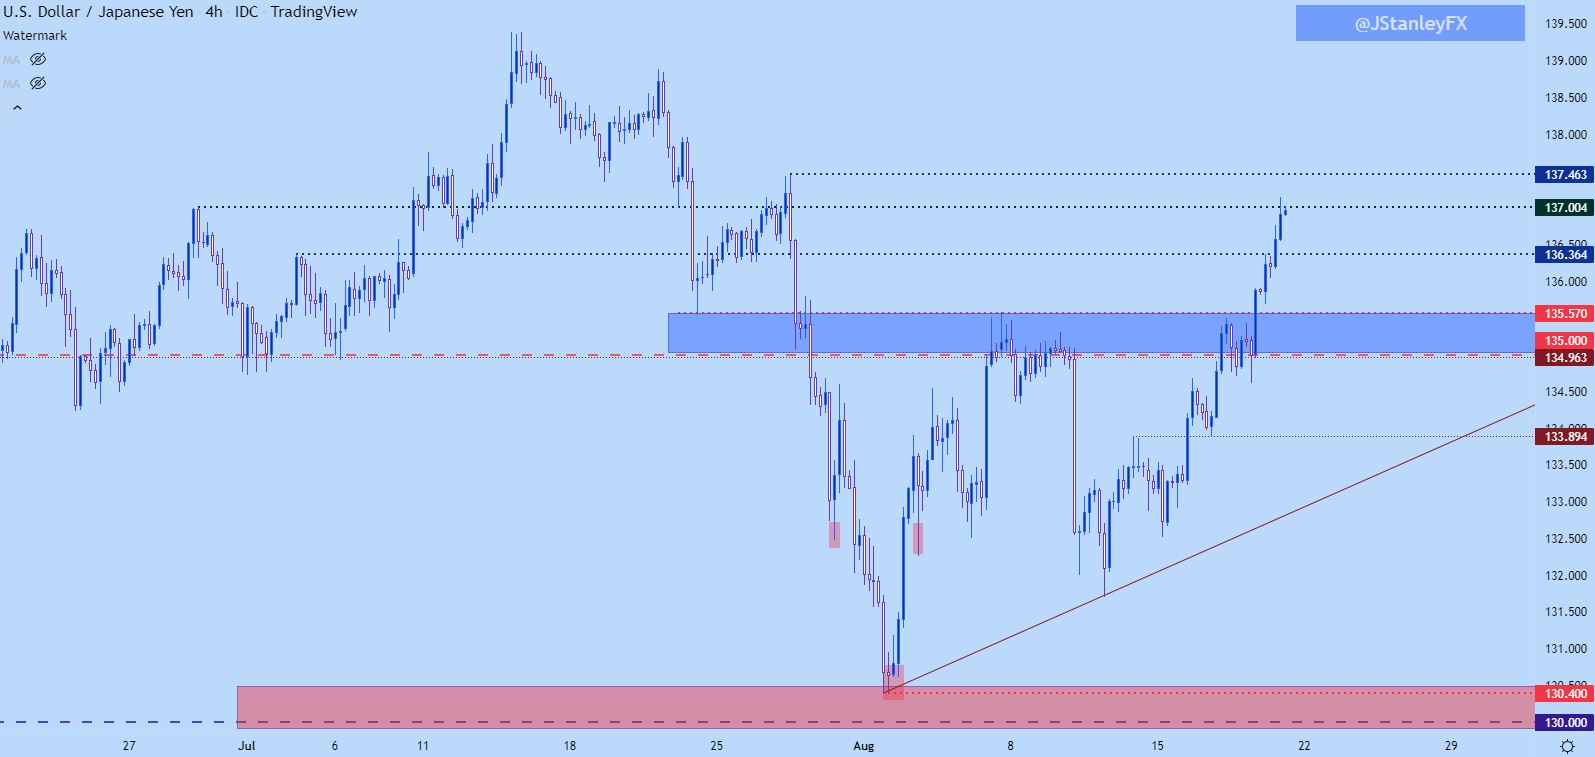
Chart prepared by James Stanley; USDJPY on Tradingview
--- Written by James Stanley, Senior Strategist, DailyFX.com & Head of DailyFX Education
Contact and follow James on Twitter: @JStanleyFX


