


Most organic things live and experience the world in cycles. Whether it’s seasons or moods or growth, contraction often leads to expansion and when that expansion gets ahead of itself – it contracts, and the cycle goes on.
Most human beings are like this, they have good days and bad days. Weather is obviously like this, but so are many sports teams or fads or, well pretty much anything else that’s governed and determined by human behavior. Markets, of course, are like this is as well.

But, more than cyclicality, it’s rare that a market will make a linear movement in a singular direction, even when compelled to do so. More often than not we’ll see a steady progression of higher-highs and higher-lows as buyers pile into an up-trend or a series of lower-lows and lower-highs as a sell-off increasingly gains momentum.
It’s like the old adage of ‘two steps forward, one step back.’ The net is still a positive and a gain has been made; but rarely is that gain going to show in a sustainable manner by moving in a linear format.
Price trends are often like this, and the logic behind it makes sense. Something good happens and that compels people to buy. Perhaps the good thing was a strong earnings report from a company or maybe it was a better-than-expected GDP report that shows even greater growth coming into that economy.
But after that motivation has been priced-in and there’s nobody left to buy, what happens? Likely, price will drop until buyers do step-in and if that good news that previously brought new buyers into the equation remains relevant, there should be ample motive for buyers to step-in before the entirety of the move is retraced, and that’s what can lead to a higher-low.

And if that good news keeps coming, this scenario can continue to play out as a series of higher-highs and higher-low builds, allowing for a bullish uptrend. This cycle takes place on a number of different time frames in a number of different ways but the general gist is the same, something good getting priced in can lead to a series of higher-highs and higher-lows and, on the other hand, something negative getting priced-in can bring on a series of lower-lows and lower-highs.
GBP/USD Daily Price Chart: Higher-Highs and Higher-Lows, Lower-Lows and Lower-Highs
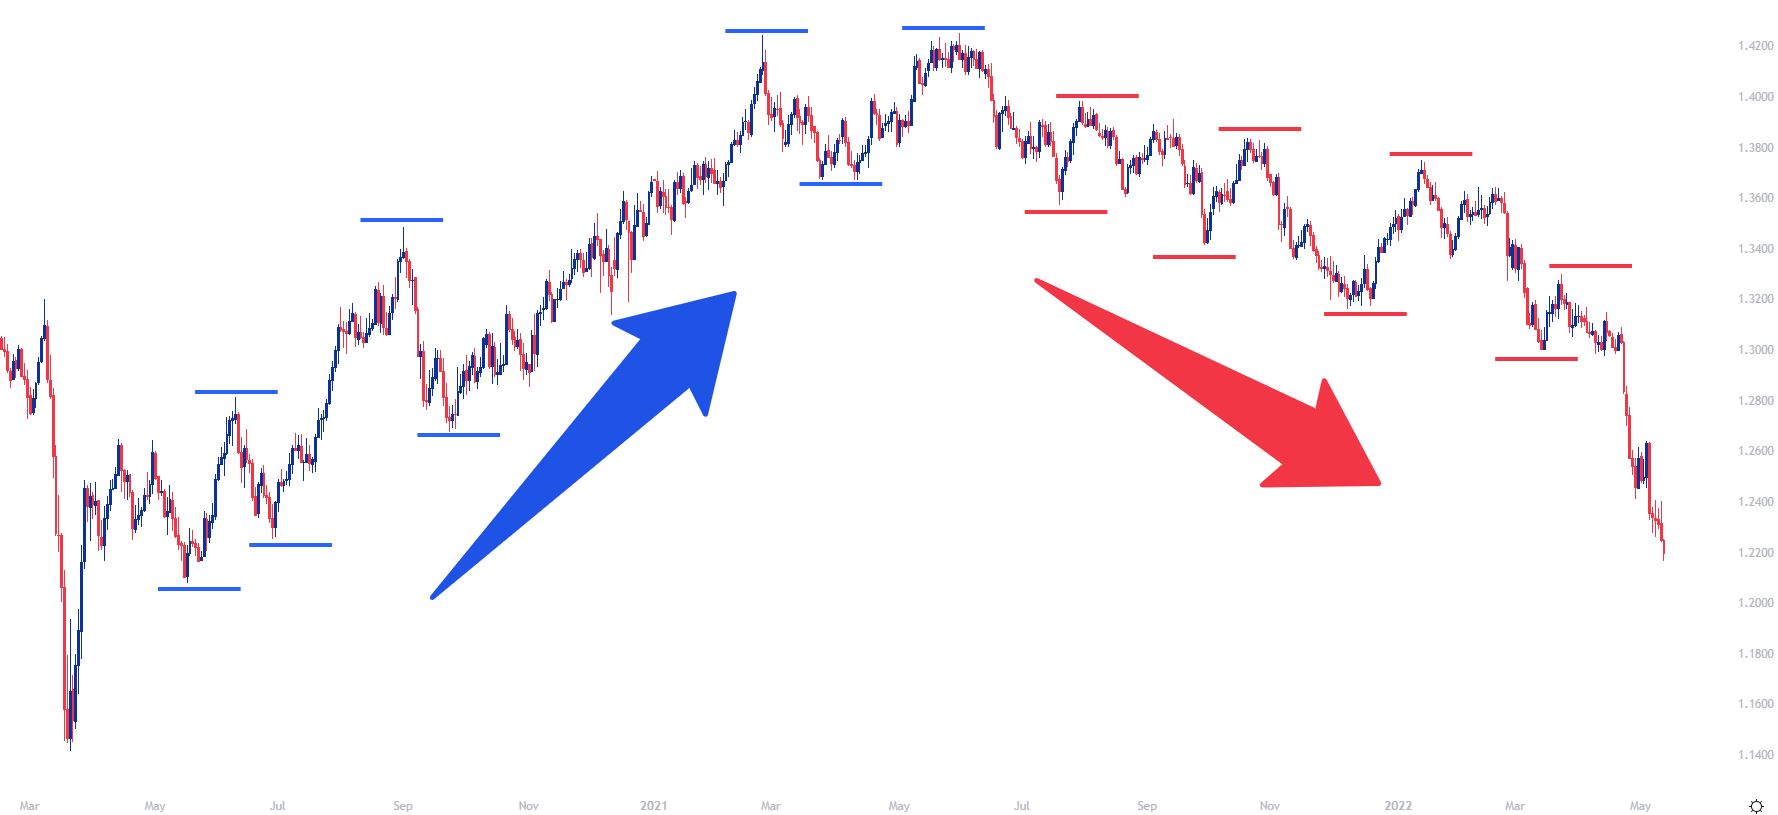
Chart prepared by James Stanley; GBP/USD daily chart, March 2020 – May 2022
Price Action Trends
The degree of those two steps forward and one step back differ, however, and the basis for that is generally going to be decided by just how excited the market is to price in that new information.
In some cases, it might seem as though it’s more of a ’ten steps forward, one step back,’ and this illustrates greater momentum as that ‘new’ information is getting priced-in. We’re looking at one such scenario in the next chart.
On the below weekly chart of the US Dollar, we’re looking at a bullish trend getting priced-in as the Federal Reserve started to open the door to rate hikes in late-2021. At the September rate decision, the Fed forecast one hike for 2022, which compelled buyers to jump into the market which forced a fresh higher-high. Later in the year, the Fed began to open the door to even more rate hikes in response to the continued gains in inflation, and that led to even higher-highs. And as that theme continued to drive so did the bullish trend.

US Dollar Weekly Price Chart
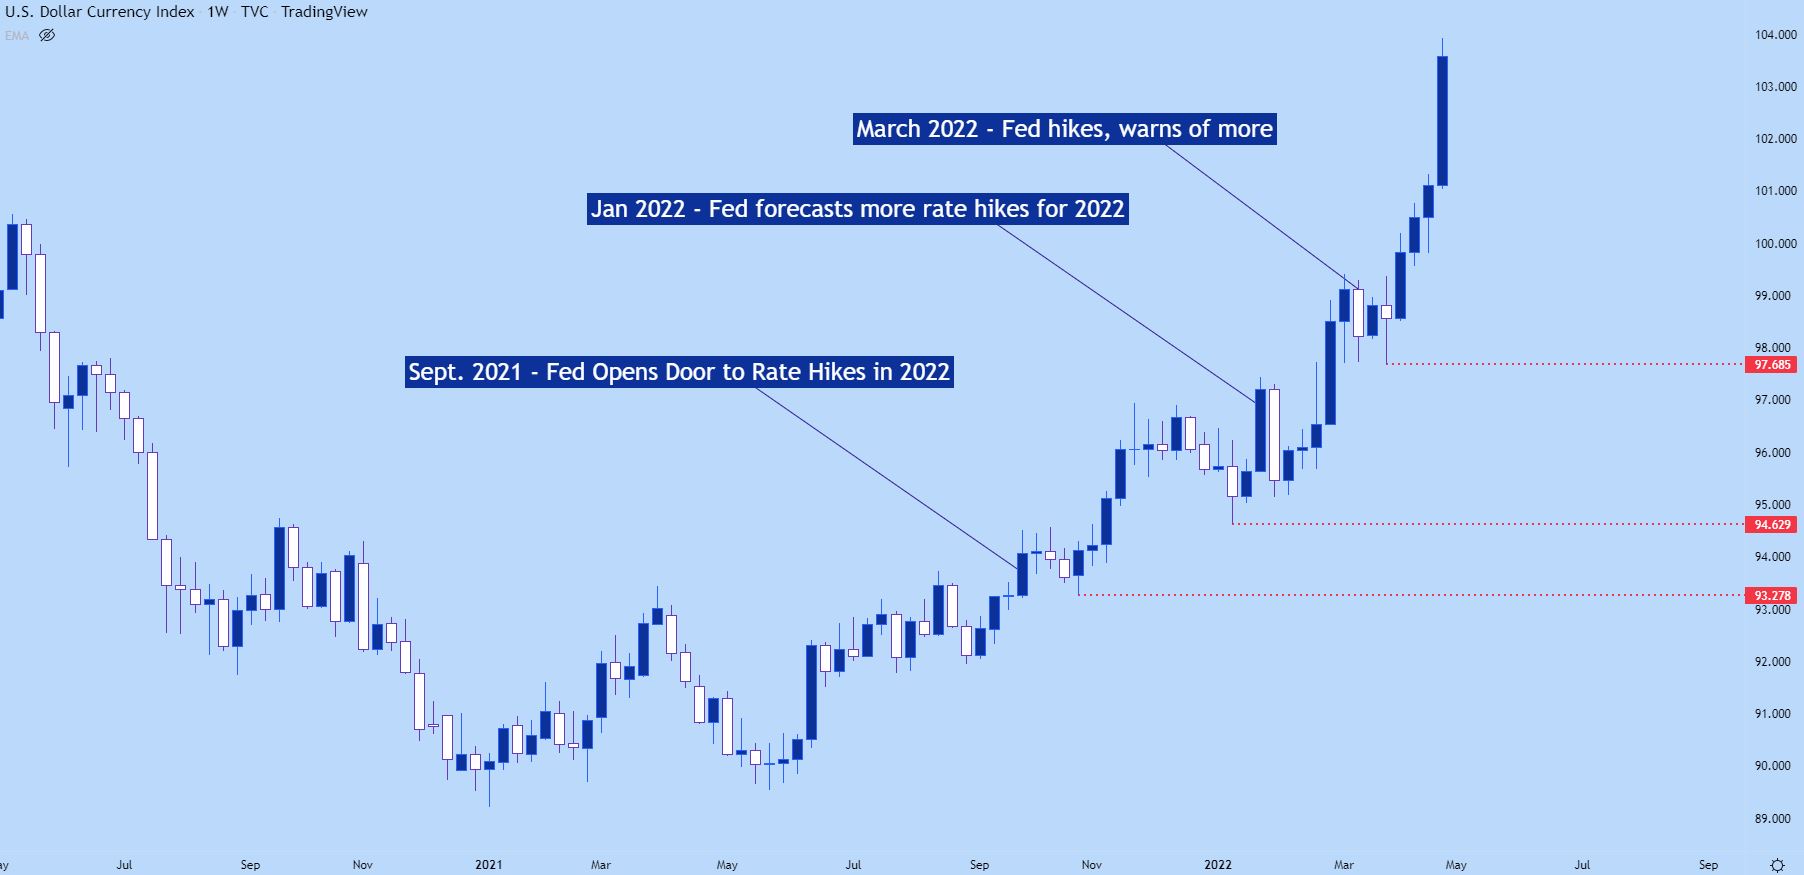
Chart prepared by James Stanley; US Dollar Weekly Chart, May 2020 – May 2022
While the higher highs are surely attractive in the above chart, the more compelling part may be the red lines or the higher-lows that followed those higher-highs.
This is illustration of the ‘one step back’ after the ‘two steps forward’ as price pushes in the trend-side direction. And for traders that are looking to get long in the trend, they’ll likely want to wait for one of those ‘one step back’ deals before looking to take on exposure. This wouldn’t necessarily require catching the exact low of that step back but, this would also give the trader some element of strategy outside of just getting long and hoping that the trend continues, as that higher-low could afford the ability to place stops below so that if the trend does bend, the loss could be mitigated.
This concept is explored in greater detail in the Price Action Support and Resistance article found in the beginning of this sub-module.
--- Written by James Stanley, Senior Strategist for DailyFX.com
Contact and follow James on Twitter: @JStanleyFX