


Forex Talking Points:
- DailyFX Quarterly Forecasts for Q2 have been recently released, and are available directly from the following link: DailyFX Trading Guides, Q2 Forecasts.
- For trading ideas, please check out our Trading Guides. And if you’re looking for something more interactive in nature, please check out our DailyFX Live webinars.
- If you’d like more color around any of the setups below, join in our live DailyFX webinars each week, set for Tuesday and Thursday at 1PM Eastern Time. You can sign up for each of those sessions from the below link:
Tuesday: Tuesday, 1PM ET
Thursday: Thursday 1PM ET
Do you want to see how retail traders are currently trading the US Dollar? Check out our IG Client Sentiment Indicator.
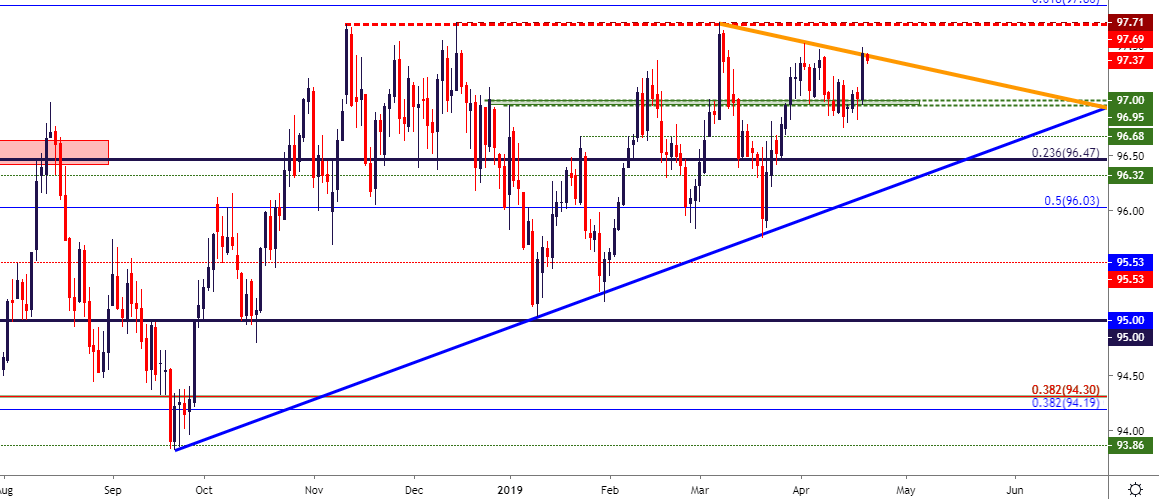
Is This the Week that USD Bulls Finally Make Their Move?
After a slow start to Q2, USD bulls came back into the equation in the latter-portion of this week, pushing prices up for a test of the bearish trend-line as taken from the March and April swing-highs. As looked at in the Thursday webinar, this creates somewhat of a challenging backdrop given that just ahead is yearly resistance around the 97.71 level. And while a re-test of that price isn’t out of the question, what is more debatable is whether buyers will have the ammunition to continue pushing above this price if a bullish breakout is to show.
This highlights the backdrop for next week, as breakout potential exists in major pairs such as EUR/USD and GBP/USD. If the late-week theme of US Dollar strength does continue, bearish breakouts in either of those pairs can remain as attractive scenarios. On the other hand, next week’s economic calendar is relatively light as it’s the final full week of April; and a plethora of drivers arrive the week after around the May open, which could be a much more opportune time for the establishment of a fresh theme across major currencies. If the USD is to shy away from resistance next week, that could keep interest around pairs such as AUD/USD or USD/CAD, as looked at below.
US Dollar Daily Price Chart
Bearish EUR/USD on Breakout Potential
This will likely be the market that has traders’ attention next week, as EUR/USD broke-below a bear flag formation on Thursday morning and sellers were able to bring on a push below 1.1250. Price action has since pulled back to this level, keeping the door open for bearish continuation. The primary complication being the rigidity of support in the six-month-old range and the fact that multiple bearish attempts have already been thwarted in this zone.
This can keep the door open for bearish breakout potential in EURUSD, in which a push below 1.1175, the March low, opens the door for further downside price action. Alternatively, for traders that want to try anticipating the breakout or pushing short-Euro stances a bit more aggressively, a hold of resistance inside of the 1.1275-1.1290 area in the early-portion of next week could allow for stops above the 1.1325-area, targeting re-tests of the 1.1200-area. At that point, break-even stop moves could be investigated as bearish breakout potential would remain on the residual portion of the position.
EUR/USD Four-Hour Price Chart

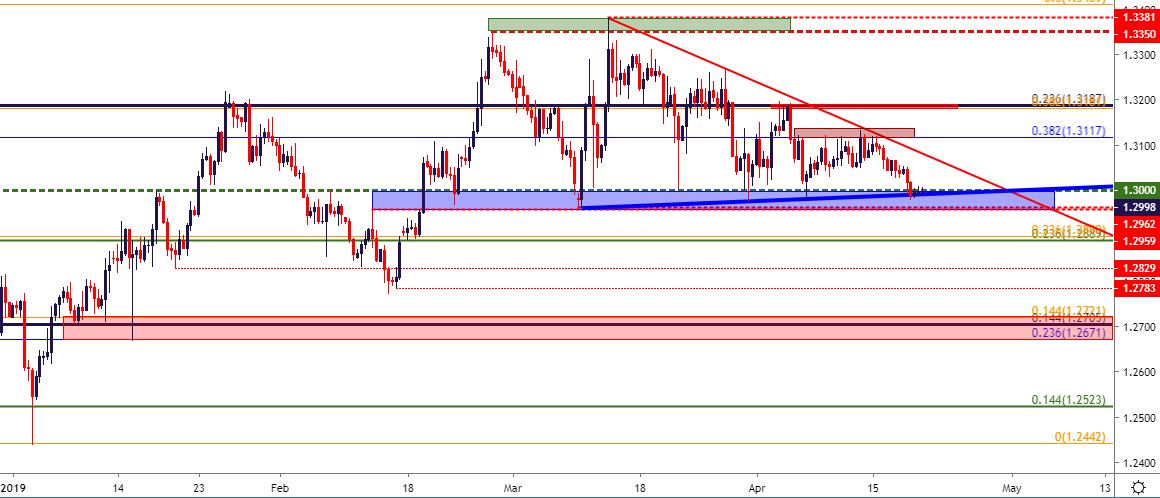
Bearish GBP/USD on Breakout Potential
Similar to the above scenario in EUR/USD with one important exception: The digestion that’s led into current prices is shorter-term in nature. While EUR/USD has been range-bound for six months, GBP/USD has experienced a few different trends during that time. A bearish Q4 led into a very bullish first two months of Q2. But since March, GBP/USD prices have been digesting that early-year move, and this has created a descending triangle formation.
The support side of this theme has built-in over the past two months around the 1.2960-1.3000 area on the chart, and this has held through multiple iterations. For resistance, a descending trend-line has developed since mid-March. This type of formation will often be approached in a bearish fashion, with the expectation that the same motivation that’s driven-in bears at lower-highs will, eventually, take-over for a break through horizontal support.
Last week, I had looked at bearish potential in GBP/USD, carried by the expectation for a revisit to support. Prices have since continued to hold around 1.3000, and this keeps the door open for breakout potential in the pair, with downside breaks opening the door for a move towards the confluent 1.2900 level on the chart. Below that, the 1.2830 level is of interest, followed by 1.2785. On a longer-term basis, a big batch of confluent support exists in the 50-pip zone between 1.2671-1.2721, and this could function as a bigger-picture target for GBP/USD in the event that bears re-gain control.
GBP/USD Eight-Hour Price Chart
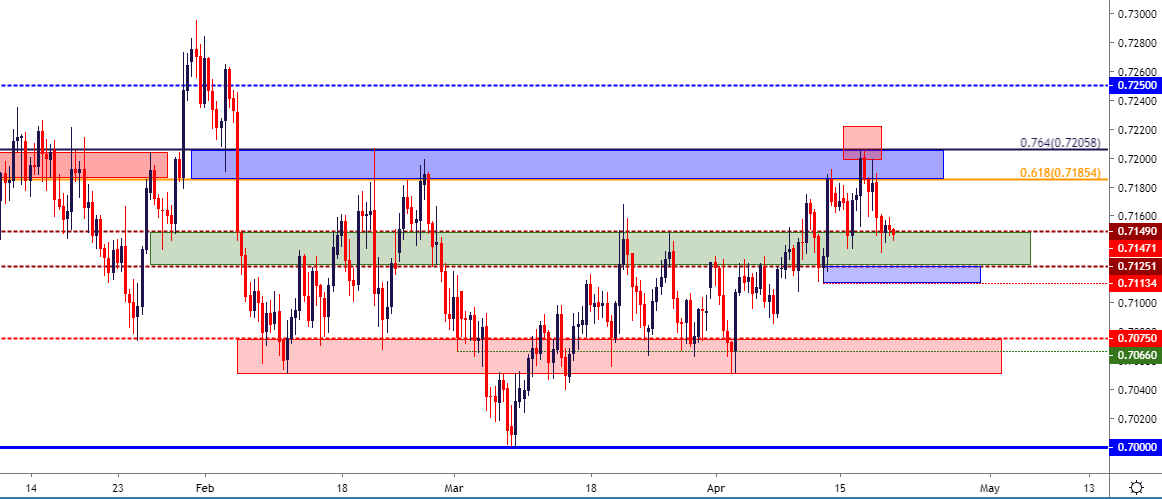
AUD/USD Range Due for a Break?
The range in AUD/USD has been consistent so far this year, and the resistance side of this formation came into play again this week by helping to mark the two-month-high in the pair. This comes in at .7206, which is the 76.4% Fibonacci retracement of the 2008-2011 major move in the pair. That resistance inflection led to a 70-pip pullback in the latter-portion of this week, right around the time that USD-strength showed up; but something else interesting showed up, which was a semblance of support around a prior area of short-term resistance.
I had looked at this setup in the Thursday webinar, hypothesizing that there may soon be a bullish move in AUD/USD should buyers show ability to hold prices above the .7113-.7125 area on the chart. This could keep the door open for a re-test of .7200, at which point break-even stop moves could be investigated. Should prices then breakout to fresh highs, target potential exists around the .7250 psychological level, just inside of the 2019 high.
AUD/USD Eight-Hour Price Chart
USD/CAD Holds Highs Near Key Resistance
Next week’s Bank of Canada rate decision will likely be one of the highlights on the economic calendar, and this meeting comes amidst a very interesting technical backdrop in USD/CAD. The pair has been range-bound for almost two months now, and above price action is a thicket of resistance as taken from a number of different Fibonacci studies.
This can keep attention on the short-side of USD/CAD, with invalidation around the 1.3470 area that marks the three-month-high in the pair. For support, target potential could exist around the 1.3290 area that marks the April-low, followed by 1.3250 and 1.3132 which helped to mark the March swing-low.
USD/CAD Four-Hour Price Chart
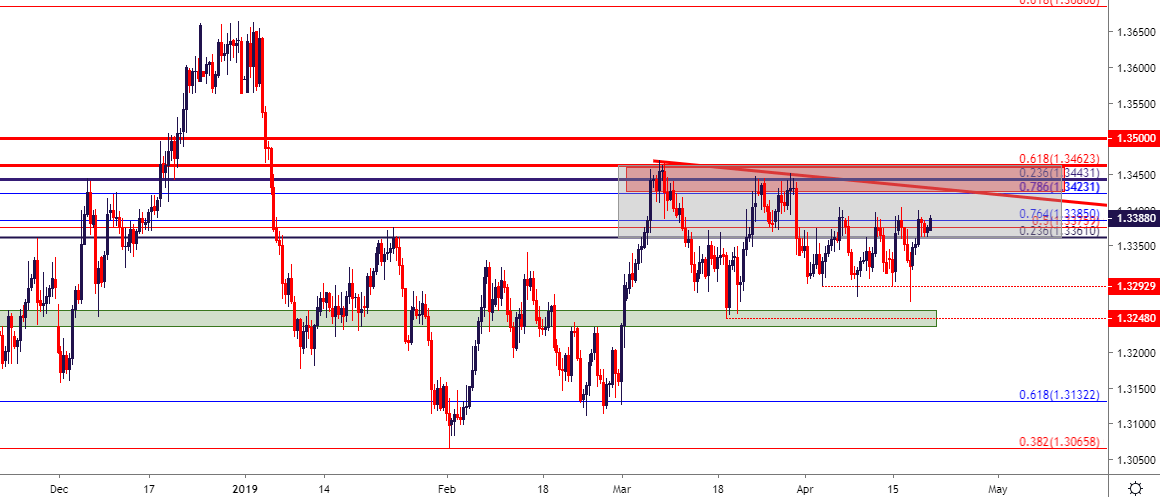
Chart prepared by James Stanley
To read more:
Are you looking for longer-term analysis on the U.S. Dollar? Our DailyFX Forecasts have a section for each major currency, and we also offer a plethora of resources on USD-pairs such as EUR/USD, GBP/USD, USD/JPY, AUD/USD. Traders can also stay up with near-term positioning via our IG Client Sentiment Indicator.
Forex Trading Resources
DailyFX offers a plethora of tools, indicators and resources to help traders. For those looking for trading ideas, our IG Client Sentiment shows the positioning of retail traders with actual live trades and positions. Our trading guides bring our DailyFX Quarterly Forecasts and our Top Trading Opportunities; and our real-time news feed has intra-day interactions from the DailyFX team. And if you’re looking for real-time analysis, our DailyFX Webinars offer numerous sessions each week in which you can see how and why we’re looking at what we’re looking at.
If you’re looking for educational information, our New to FX guide is there to help new(er) traders while our Traits of Successful Traders research is built to help sharpen the skill set by focusing on risk and trade management.
--- Written by James Stanley, Strategist for DailyFX.com
Contact and follow James on Twitter: @JStanleyFX


