


Forex Talking Points:
- DailyFX Quarterly Forecasts for Q2 have been recently released, and are available directly from the following link: DailyFX Trading Guides, Q2 Forecasts.
- For trading ideas, please check out our Trading Guides. And if you’re looking for something more interactive in nature, please check out our DailyFX Live webinars.
- If you’d like more color around any of the setups below, join in our live DailyFX webinars each week, set for Tuesday and Thursday at 1PM Eastern Time. You can sign up for each of those sessions from the below link:
Tuesday: Tuesday, 1PM ET
Thursday: Thursday 1PM ET
Do you want to see how retail traders are currently trading the US Dollar? Check out our IG Client Sentiment Indicator.
FX Market Congestion Continues – Is a Break Nearing?
With the first week of Q2 almost in the books, the potential for a continuation of US Dollar strength remains as one of the more interesting themes across the FX landscape. To be sure, the dearth of volatility remains as a number of pairs continue with congestion or range formations. Much of this can be drawn back to the FX market’s two largest venues in EURUSD and the US Dollar; both of which are remain in non-directional patterns that go back to Q4 of last year.
Next week’s economic calendar brings a few items of interest that may help to break that impasse. On Thursday of next week, the European Central Bank speaks to markets following the March rate decision that saw an announcement of fresh stimulus. That led into a quick move of Euro-weakness around the announcement, which helped the US Dollar to rally up to a key point of chart resistance: But less than 24 hours after that stimulus announcement a very disappointing NFP report was released, and USD-weakness, and Euro-strength took over for the next week-and-a-half.
Below I look into four USD-related markets, with breakout potential in the two major pairs of EURUSD and GBPUSD to go along with range or mean-reversion potential in AUDUSD and USDCAD.
EURUSD Bullish on Hold Above 1.1187, Bearish on Breaks Below 1.1175
Surprisingly, the ECB’s announcement of another fresh round of TLTRO’s had a bullish impact on EURUSD for much of March. Sure, the initial reaction was a test-below a key zone that makes up the support side of a range that had been in-force for four months (five months, at this point); but that was soon followed by a bullish move in the pair that saw EURUSD rally all the way up to range resistance at 1.1448. It wasn’t until after the FOMC rate decision later in the month that Euro bears were able to re-gain control; and that theme has lasted through the first week of Q2.
This week saw a few different tests around that support zone; and as I remarked in the Thursday webinar, this appears to be a bear trap on a longer-term basis.
EURUSD price action has found higher-low support at the Fibonacci level of 1.1212, which is the 61.8% retracement of the ‘lifetime move’ in the pair. Just below that, at 1.1187 is the 61.8% retracement of the 2017-2018 major move, helping to mark the low-end of that range support. A hold above these levels through next week’s open keeps the door open for topside strategies, targeting an initial test of 1.1250 followed by secondary targets at the 1.1300 handle.
EURUSD Four-Hour Price Chart

Should bears begin to make headway on a break below support, particularly in the lead-up to the ECB rate decision on Thursday, and bearish breakouts can begin to get attractive again. The post-ECB and March swing-low came-in around 1.1175, and a down-side push below this price can begin to open the door for bearish strategies; with initial targets around the 1.1125 level.
EURUSD Weekly Price Chart

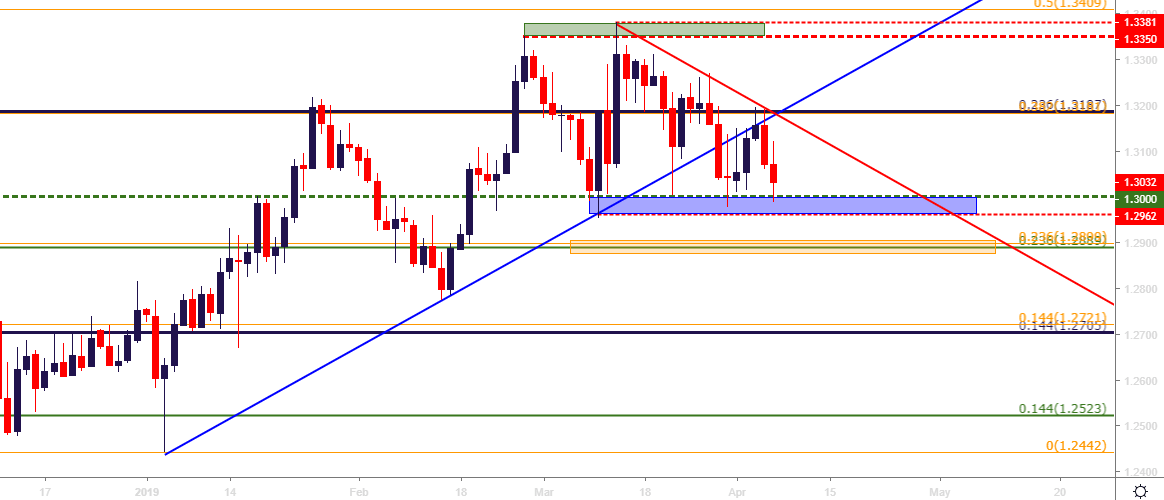
GBPUSD Re-Tests 1.3000: Break or Bounce
There’s a similar backdrop in GBPUSD at the moment and with Brexit remaining forceful in the headlines, markets are likely due for a continuation of volatility there.
Earlier this week I looked into a zone of confluent resistance in GBPUSD; and that held as prices pushed back down to the 1.3000 big figure. This is a zone of support that’s held the lows in the pair for six weeks now, and that support has held through a variety of bearish drivers on the Brexit-front. A hold of the support zone that runs from 1.2962-1.3000 can keep the door open for bullish strategies in the pair, looking for prices to move back towards 1.3087-1.3117, followed by a re-test of the 1.3181-1.3187 area that cauterized this week’s highs.
GBPUSD Four-Hour Price Chart

On a longer-term basis, as discussed yesterday, there may be brewing bearish trend potential brewing in GBPUSD. Late-March price action saw prices push below a key trend-line on the chart that had held the lows for almost all of Q1. That support trend-line came in as resistance this week around that confluent spot on the chart; and this may be signaling the oncoming of fresh trend potential in the pair.
If sellers are able to push below support, the door could soon open to bearish breakout potential, initially targeting the confluent area around the 1.2900 handle on the chart.
GBPUSD Daily Price Chart
Bearish USDCAD on Hold Below 1.3470
On the mean-reversion side of the matter, USDCAD remains of interest as the pair trades very near an area of longer-term resistance. I had discussed USDCAD at length in this morning’s report entitled, USDCAD Re-Test 1.3400 as Canadian Jobs Data Disappoints; finishing the piece with a look at the weekly chart in USDCAD.
There are two longer-term Fibonacci levels sitting just above current prices that have helped to hold the highs inside of 1.3500 over the past month. At 1.3443 is the 23.6% retracement of the 2011-2016 major move; and at 1.3463 is the 61.8% retracement of the 2001-2007 major move. As discussed this morning, a hold of resistance at-or-below this area can keep the door open for short-side strategies, particularly for traders looking to bet against a bullish breakout in the US Dollar’s ascending triangle formation.
USDCAD Weekly Price Chart

AUDUSD Range Sets the Battle Lines
Also in the realm of mean reversion is the multi-month range that continues to hold in AUDUSD. Despite the US Dollar’s theatrics in the month of March, AUDUSD has remained fairly consistent. Support has held from around .7050-.7075 over the past few weeks; while resistance has continued to come-in around .7125-.7150. So, there hasn’t been a lot of stretch; but the consistency with which this has held can keep the door open for range continuation.
Outside of these boundaries are more pertinent support/resistance areas; with support around the .7000 big figure on the other side of the resistance zone that’s held from .7185-.7206. If the tighter range breaks, mean reversion could still be sought out at either of these respective zones, with bears holding on to short-side strategies until the .7206 level is taken out, while bulls focus-in on support defense of the .7000 psychological level until that’s taken-out.
AUDUSD Four-Hour Price Chart

Chart prepared by James Stanley
To read more:
Are you looking for longer-term analysis on the U.S. Dollar? Our DailyFX Forecasts have a section for each major currency, and we also offer a plethora of resources on USD-pairs such as EUR/USD, GBP/USD, USD/JPY, AUD/USD. Traders can also stay up with near-term positioning via our IG Client Sentiment Indicator.
Forex Trading Resources
DailyFX offers a plethora of tools, indicators and resources to help traders. For those looking for trading ideas, our IG Client Sentiment shows the positioning of retail traders with actual live trades and positions. Our trading guides bring our DailyFX Quarterly Forecasts and our Top Trading Opportunities; and our real-time news feed has intra-day interactions from the DailyFX team. And if you’re looking for real-time analysis, our DailyFX Webinars offer numerous sessions each week in which you can see how and why we’re looking at what we’re looking at.
If you’re looking for educational information, our New to FX guide is there to help new(er) traders while our Traits of Successful Traders research is built to help sharpen the skill set by focusing on risk and trade management.
--- Written by James Stanley, Strategist for DailyFX.com
Contact and follow James on Twitter: @JStanleyFX


