


US Dollar Talking Points:
- The US Dollar continues to trade within the confines of previously established support and resistance, with buyers showing up around the 97.00 level yesterday to pose another topside push up to near-term resistance around 97.21-97.30. This extends a pattern of digestion that’s been showing in varying forms since November of last year. Tomorrow’s economic calendar brings March Non-Farm Payroll numbers: Will this be the driver that finally helps the US Dollar test the topside of the brewing ascending triangle formation?
- Given the lack of long-term trends in USD, a number of potential breakout scenarios are present in major pairs such as USD/JPY and EUR/USD. USD/CHF, on the other hand, may be showing a potential trend setup that could remain of interest for those looking at strategies of USD-weakness ahead of or around tomorrow’s NFP report.
- DailyFX Forecasts are published on a variety of currencies such as the US Dollar or the Euro and are available from the DailyFX Trading Guides page. If you’re looking to improve your trading approach, check out Traits of Successful Traders. And if you’re looking for an introductory primer to the Forex market, check out our New to FX Guide.
Do you want to see how retail traders are currently trading the US Dollar? Check out our IG Client Sentiment Indicator.
US Dollar Churns into NFP
The first week of Q2 is almost complete; and much as FX markets have become accustomed to, the US Dollar has continued to show digestion as prices work deeper within an ascending triangle formation. As looked at in the Q2 Technical Forecast for the US Dollar, this is a pattern that will often be approached in a bullish manner – looking for the same enthusiasm that’s driven bulls in at higher-lows to, eventually, take over to allow for a breakout at horizontal resistance.
Access the DailyFX Q2 Forecasts for USD, Euro, GBP and More
US Dollar Daily Price Chart
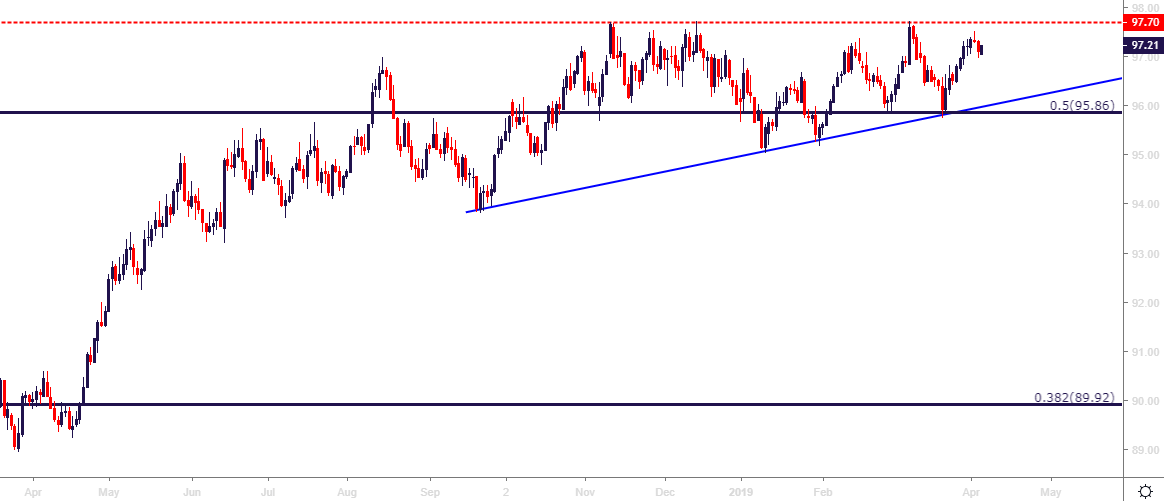
Chart prepared by James Stanley
At this point, the devils is in the details as prices in USD have been adhering to previously established support and resistance levels inside of that longer-term ascending triangle. Yesterday saw a bounce off of a familiar zone around 97.00; and that’s led into a push up to 97.21-97.30.
This doesn’t make for much excitement around USD price action at the moment, but the big question is whether markets may be on the cusp of a breakout that could do away with that recent impasse. Tomorrow brings Non-Farm Payrolls out of the Untied States, and last months release of this data point brought upon almost two weeks of weakness in the Greenback. This is around the time DXY folded after failing to breakout at the resistance side of that ascending triangle. That led into almost two weeks of weakness as prices traversed the entirety of the formation – eventually finding support around the bullish trend-line just after the March FOMC rate decision.
Will tomorrow bring that breakout around NFP after a very different outcome last month?
US Dollar Four-Hour Price Chart
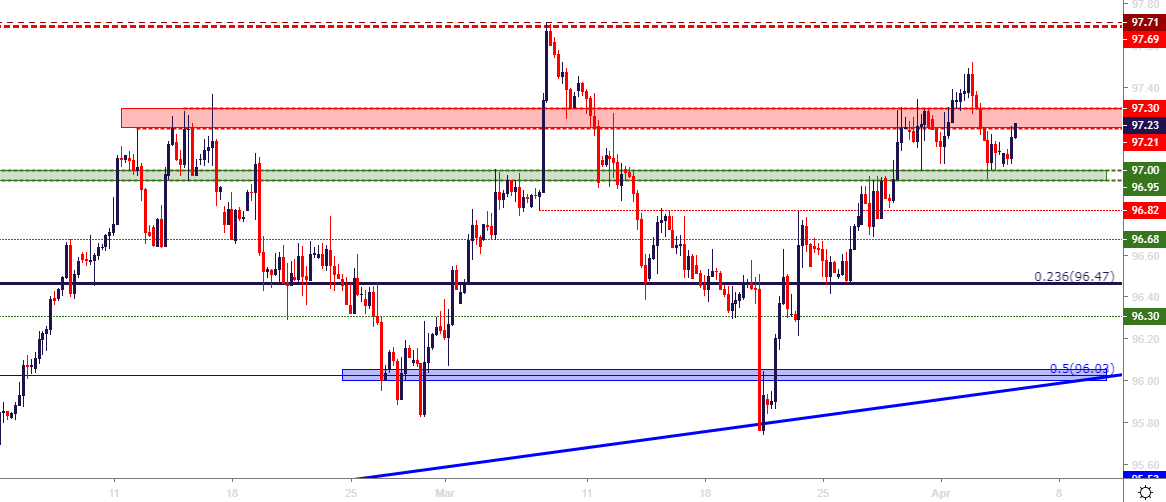
Chart prepared by James Stanley
EURUSD Re-Buffed At Range Support
Going along with that theme of potential strength in the US Dollar is a backdrop of bearish breakout potential around EURUSD. Similar to the US Dollar above, EURUSD has been building into a range formation since last November; and this has held through a variety of fundamental events. The pair has continued to find support around two key Fibonacci levels: At 1.1212 is the 61.8% retracement of the ‘lifetime move’ in EURUSD, and just below that at 1.1187 is the 61.8% retracement of the 2017-2018 bullish move in the pair.
The latter of those levels has already come into play in the opening days of Q2, as a quick push down to support was soundly re-buffed by buyers; although this may be more of an element of short-cover as the pair re-encountered a big support area that led to a strong reversal last month. As looked at yesterday, prices in the pair trickled all the way up to the 1.1250 psychological level, at which point sellers came back-in to temper the highs.
EURUSD Four-Hour Price Chart
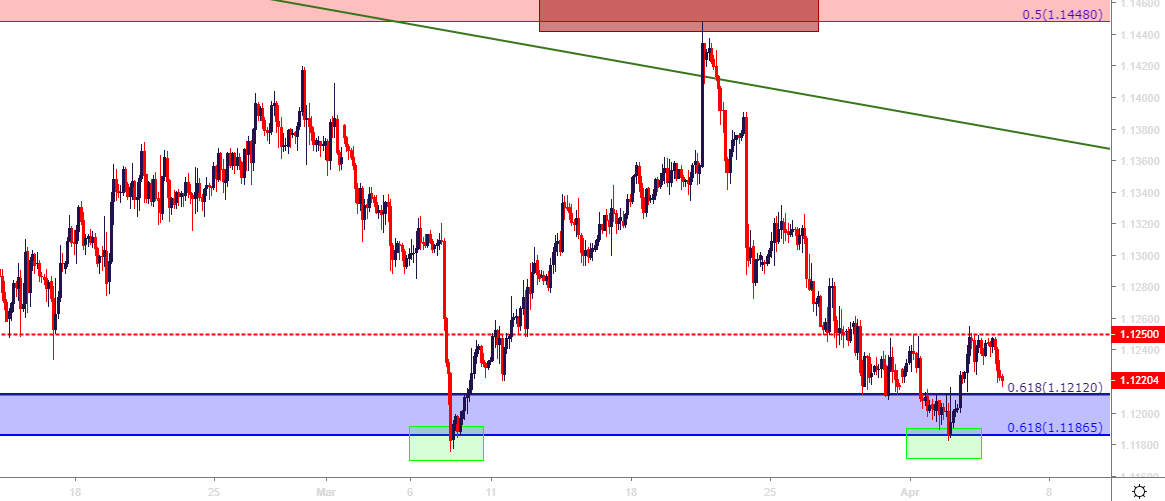
Chart prepared by James Stanley
The big question around EURUSD is connected to the similar theme in USD: Can bears finally pose a break of range support, which would go along with a topside break of the US Dollar’s ascending triangle? Tomorrow’s NFP report could provide catalyst for such a move.
EURUSD Daily Price Chart

Chart prepared by James Stanley
USDJPY Tests Trend-line Resistance as Risk Appetite Returns
The March FOMC rate decision was interesting on a number of levels: The FOMC cut rate forecasts for 2019, previously looking at two hikes and now looking at zero. This would normally be music to the ears of risk-bulls; but matters didn’t exactly play out like that. In the aftermath of that rate decision, risk aversion began to show, perhaps as a signal of fear from the Fed’s flip. In short-order, the US Yield curve showed inversion as the 3-month Treasury Bill yielded more than the 10-Year Treasure Note; an observation that hadn’t been seen since 2007, just before the financial collapse.
Also notable was the re-appearance of Yen-strength. USDJPY had spent much of Q1 recovering from a nasty spill in the opening days of 2019. That bullish backdrop remained for most of the period, until that FOMC rate decision, at which point prices broke-down to a prior support level around 109.67-110.00.
But – that support has held the lows, and as the risk-on market mode has returned with a more dovish Fed in the backdrop, prices in USD/JPY have re-ascending back-above the 110.00 level.
At this point, USDJPY is testing resistance at a descending trend-line taken from the March swing-highs. This can set the pair up for scenarios in either direction: For traders looking at the risk-off theme, there’s an abundance of resistance points sitting above current price that can be used for reversal scenarios. For bulls looking at long exposure in USD or bearish exposure in JPY, those same points of resistance can be incorporated for breakout strategies, targeting a test of the 112.34 Fibonacci level.
USDJPY Four-Hour Price Chart
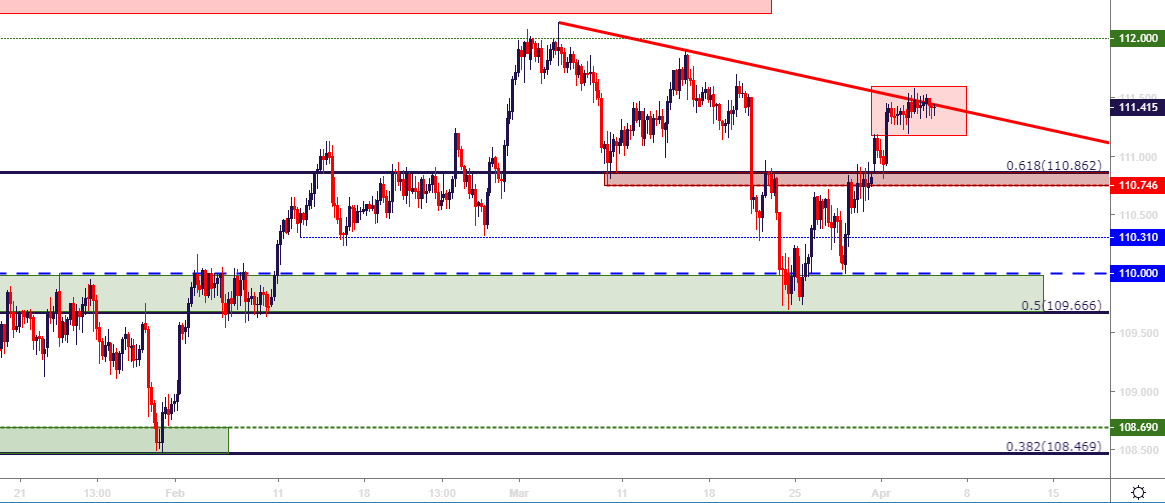
Chart prepared by James Stanley
USDCHF Moves Back Towards Resistance Zone
While short-side USD strategies in EURUSD may be lacking interest because, well, that would require one to be long Euro; the short-side of USD/CHF may hold some attraction going into tomorrow’s FOMC rate decision. The pair found support at a key Fibonacci level in the waning days of March, and prices have been moving higher in an almost begrudging fashion since. An area of resistance around the parity level came into play on Tuesday, and that’s holding the Q2 highs for now. But, if sellers come back in to show continued respect of this level, particularly if this comes with a lower-high, the door can remain open for short-side strategies, looking for a revisit of the Fibonacci level around .9902.
USDCHF Four-Hour Price Chart

Chart prepared by James Stanley
To read more:
Are you looking for longer-term analysis on the U.S. Dollar? Our DailyFX Forecasts for Q4 have a section for each major currency, and we also offer a plethora of resources on USD-pairs such as EUR/USD, GBP/USD, USD/JPY, AUD/USD. Traders can also stay up with near-term positioning via our IG Client Sentiment Indicator.
Forex Trading Resources
DailyFX offers an abundance of tools, indicators and resources to help traders. For those looking for trading ideas, our IG Client Sentiment shows the positioning of retail traders with actual live trades and positions. Our trading guides bring our DailyFX Quarterly Forecasts and our Top Trading Opportunities; and our real-time news feed has intra-day interactions from the DailyFX team. And if you’re looking for real-time analysis, our DailyFX Webinars offer numerous sessions each week in which you can see how and why we’re looking at what we’re looking at.
If you’re looking for educational information, our New to FX guide is there to help new(er) traders while our Traits of Successful Traders research is built to help sharpen the skill set by focusing on risk and trade management.
--- Written by James Stanley, Strategist for DailyFX.com
Contact and follow James on Twitter: @JStanleyFX


