


Forex Talking Points:
- If you’re looking to improve your trading approach, our Traits of Successful Traders research could help. This is based on research derived from actual results from real traders, and this is available to any trader completely free-of-charge.
- If you’re looking for a primer on the FX market, we can help. To get a ground-up explanation behind the Forex market, please click here to access our New to FX Trading Guide.
If you’d like to sign up for our webinars, we host an event on Tuesday and Thursday, each of which can be accessed from the below links:
Tuesday: Tuesday, 1PM ET
Thursday: Thursday 1PM ET
US Dollar: Ascending Triangle, but Are Bulls Ready for a Break?
The longer-term setup in the US Dollar is a bit more clear than what’s been taking place shorter-term. As discussed in the Q2 Forecast for USD, the US currency has been building into an ascending triangle pattern over the past few months; the entirety of which was traversed in the month of March around key NFP and FOMC drivers. Earlier in the month, just after the ECB rate decision, the US Dollar moved up to find resistance at the yearly high around 97.70.
Access the DailyFX Q2 Forecasts for USD, Euro, GBP and More
US Dollar Daily Price Chart
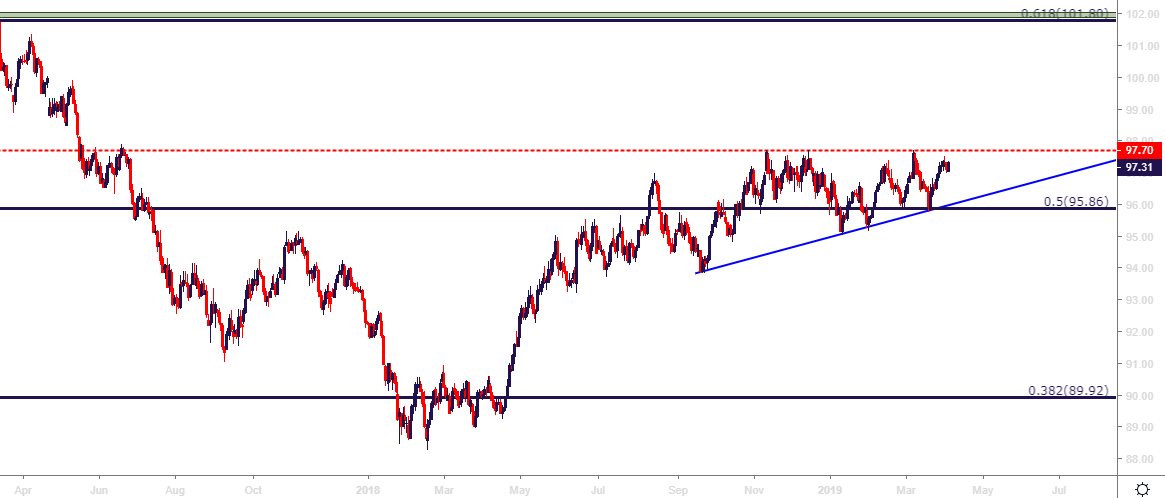
That NFP print came out very nasty with a headline print of +20k, and that led into a very visible move of USD-weakness that lasted into the FOMC rate decision later in the month.
At that meeting, the FOMC went dovish, forecasting zero rate hikes in 2019 versus the prior expectation of two. That gave a quick move of USD-weakness, until support came-in from the bullish trend-line making up the support side of that triangle. USD bulls have largely remained in-control since, and short-term, USD is looking stretched; making the prospect of trading for that bullish breakout a bit of a challenge at this point outside of any exogenous stimuli? Can NFP provide that motive tomorrow? Or will US Dollar bulls have to re-load before this big area of resistance can finally be taken-out?
US Dollar Four-Hour Price Chart

EURUSD: Traps Are Brewing
Longer-term, this looks like it may be a bear trap. Prices in EURUSD are testing a big zone of support that’s held-up through a variety of drivers over the past few months, and bears have had ample opportunity to take-control of the matter. To date, they haven’t; and this theme appears to be inextricably linked to the bullish backdrop in the US Dollar above. When USD is finally able to break-above that ascending triangle, short-side breakout strategies may soon become attractive again in EURUSD.
EURUSD Daily Price Chart

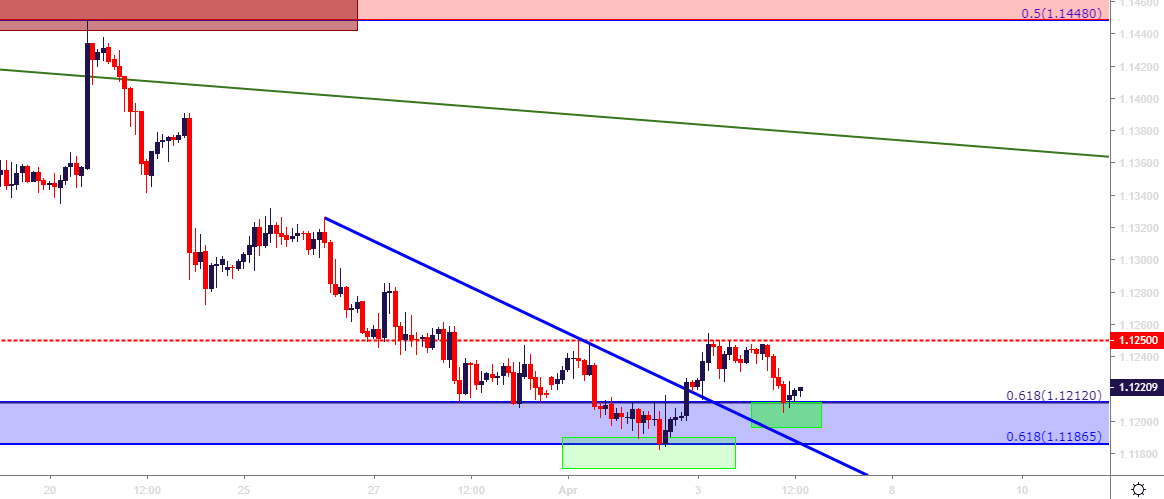
On the other side of the matter: Shorter-term, there could be a bull trap here, as well, with support showing at a prior area of resistance around 1.1212, which is the 61.8% Fibonacci retracement of the ‘lifetime move’ in EURUSD.
On the bullish side of the pair, it seems there are simply more attractive venues for those themes: Long EURJPY for strategies of Euro strength, allowing the trader to avoid USD-dynamics. And for traders looking at short-side USD strategies, USDCHF may be more attractive.
EURUSD Two-Hour Price Chart
GBPUSD: Cable Clearing Up?
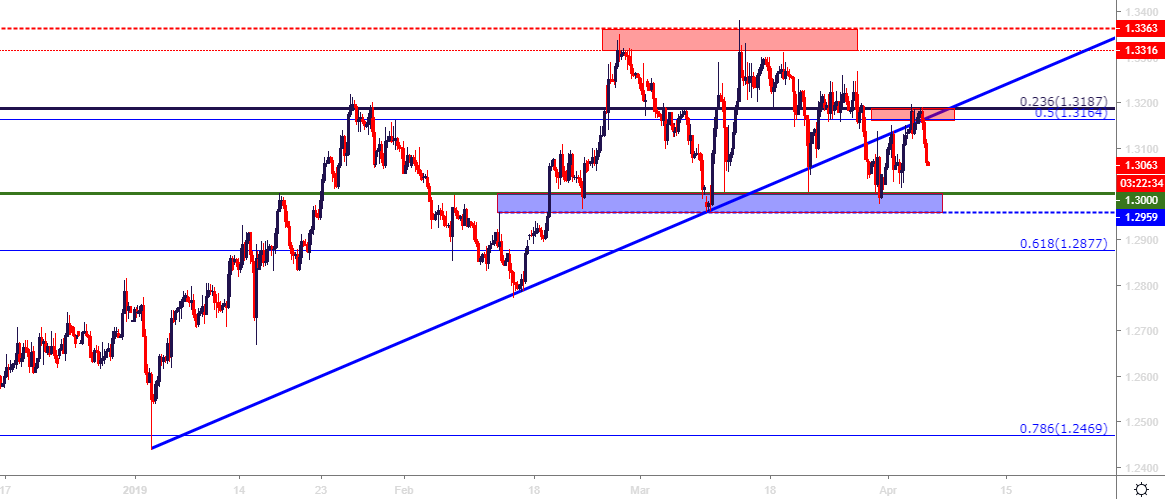
I had written a technical article on GBPUSD earlier today; looking at prices pushing below a bullish trend-line that had previously held the 2019 lows. For now, the focus is on support around the 1.3000-handle to see if that can hold another swing-low in the pair. If it can’t – short-side themes may soon become attractive again and this could remain as attractive with long-USD backdrops.
GBPUSD Eight-Hour Price Chart
USDJPY Tip-Toes Above Resistance
USDJPY strength has been on the return, and prices have started to push above a bearish trend-line this morning that connects the March swing highs in the pair. Just above that are a number of Fibonacci levels, with 50% markers from both the 1998-2011 and 2016-2018 major moves nearby. This can keep the Yen as a point-of-interest for Euro and GBP setups.
USDJPY Eight-Hour Price Chart

EURJPY With Bullish Potential On Hold of 125.00
After a bearish finish to what was generally a positive Q1 for EURJPY, prices in the pair have ran-above a key level on the chart at 125.00. This was previously a resistance zone that kept the door open for short-side strategies; but with prices breaking-above and then finding support at prior resistance, the door may soon be opening for bullish continuation strategies in the pair. This could remain particularly attractive to Euro bulls as opposed to the above setup in EURUSD.
EURJPY Two-Hour Price Chart

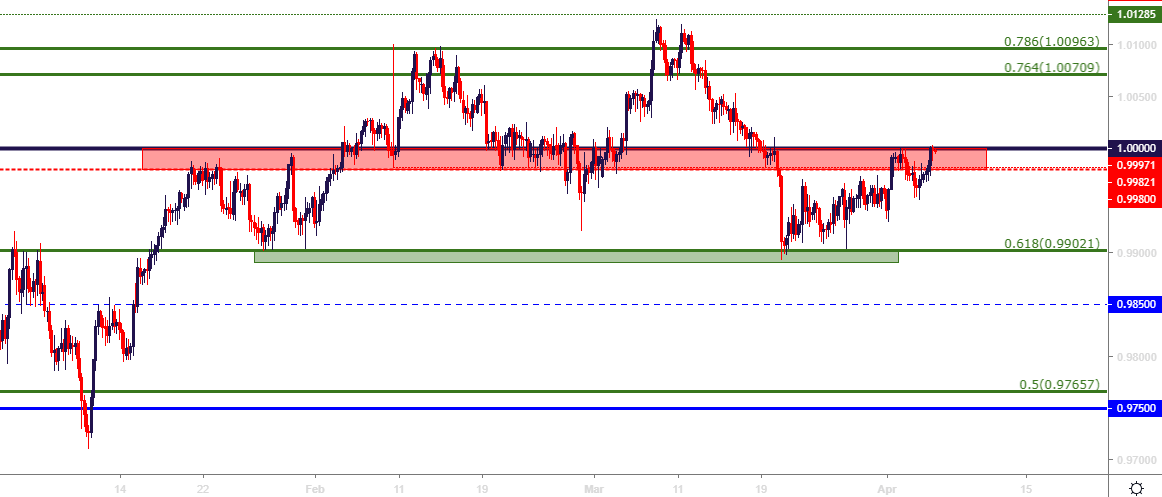
USDCHF: Corrective Move Off of Support Runs into Potential Resistance at Parity
On the short-side of USD, USDCHF remains of interest. Prices in the pair tipped-down to .9902, which is the 61.8% retracement of the 2016-2018 major move in the pair; and this helped to set the March low around the FOMC rate decision. Since then, however, prices have been retracing, and over the past few days running into resistance around the .9980-1.000 area on the chart.
USDCHF Four-Hour Price Chart
Gold Re-Tests Key Support
The stage is set for tomorrow, and Gold prices will likely be on the move given the intense focus that’s been showing on the matter. Last month saw a topside breakout around FOMC; but since then, bears have been pushing back down to the 2019 support zone that runs from around 1275-1286. This keeps the door open for bullish strategies, until that support zone is violated and taken-out, which will likely share some link to bullish breakout possibilities in the US Dollar’s ascending triangle.
Gold Four-Hour Price Chart

Oil Hits Key Fibonacci Level
Crude Oil prices have continued to run-higher following the March breakout, and prices are now finding resistance at 62.84. This is the 38.2% retracement of the 1998-2008 major move in Oil, and this is a Fibonacci study that’s produced a multitude of support/resistance inflections in the past.
While this may not be enough to gain excitement around bearish reversals; it could help to stall the bullish advance enough to bring focus back on higher-low support. The prior area of resistance around the 60-handle remains attractive for such themes, and below that 57.47-57.85 and then around the 55-handle, where the March lows had come-in.
For those that do want to try their hand at bearish reversals, initial targets would likely be above that 60-level, just in case it comes in as higher-low support.
US Oil Daily Price Chart
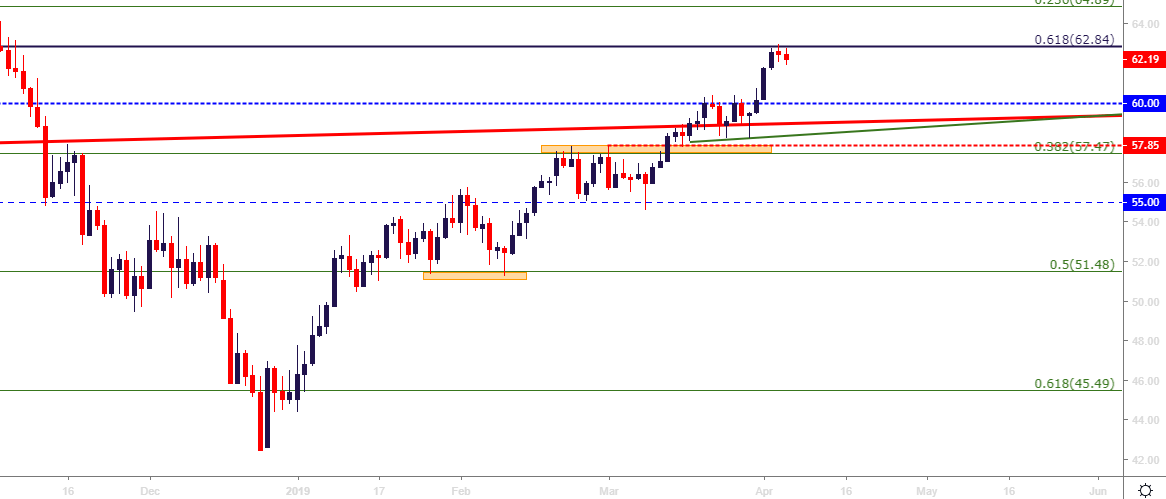
Chart prepared by James Stanley
To read more:
Are you looking for longer-term analysis on the U.S. Dollar? Our DailyFX Forecasts for Q4 have a section for each major currency, and we also offer a plethora of resources on USD-pairs such as EUR/USD, GBP/USD, USD/JPY, AUD/USD. Traders can also stay up with near-term positioning via our IG Client Sentiment Indicator.
Forex Trading Resources
DailyFX offers an abundance of tools, indicators and resources to help traders. For those looking for trading ideas, our IG Client Sentiment shows the positioning of retail traders with actual live trades and positions. Our trading guides bring our DailyFX Quarterly Forecasts and our Top Trading Opportunities; and our real-time news feed has intra-day interactions from the DailyFX team. And if you’re looking for real-time analysis, our DailyFX Webinars offer numerous sessions each week in which you can see how and why we’re looking at what we’re looking at.
If you’re looking for educational information, our New to FX guide is there to help new(er) traders while our Traits of Successful Traders research is built to help sharpen the skill set by focusing on risk and trade management.
--- Written by James Stanley, Strategist for DailyFX.com
Contact and follow James on Twitter: @JStanleyFX


