


GBPUSD Talking Points:
- GBPUSD closed Q1 after another test of the key psychological level of 1.3000, with prices bouncing above this price ahead of last week’s close. That bounce has thus far continued in the opening hours of Q2 as GBPUSD has pushed back-above the 1.3100 area. Can buyers sustain the move? Or will this be a continuation of the jagged back-and-forth price action in Cable that’s become commonplace over the past month?
- Brexit dynamics continue to elicit volatility around the British Pound and when combined with some interesting themes around the US Dollar, GBPUSD has been fairly erratic of recent. This makes the prospect of timing longer-term trends a challenge, particularly as Brexit remains wrapped in opacity.
- DailyFX Forecasts are published on a variety of currencies such as the US Dollar or the Euro and are available from the DailyFX Trading Guides page. If you’re looking to improve your trading approach, check out Traits of Successful Traders. And if you’re looking for an introductory primer to the Forex market, check out our New to FX Guide.
Do you want to see how retail traders are currently trading GBPUSD? Check out our IG Client Sentiment Indicator.
With a bit of hindsight, the first quarter of this year doesn’t look all that bad for the British Pound. GBPUSD put in a strong gain in January after a very rough first few days of trade; and that strength continued in February. But a different tone showed in the month of March, which was originally supposed to be the date of the official split from the European Union. Of course, that didn’t happen, and nobody is quite sure yet when, or even if, this will take place. And GBPUSD price action echoed that sentiment last month as prices clawed back the entirety of the February gain and then some.
GBPUSD Monthly Price Chart
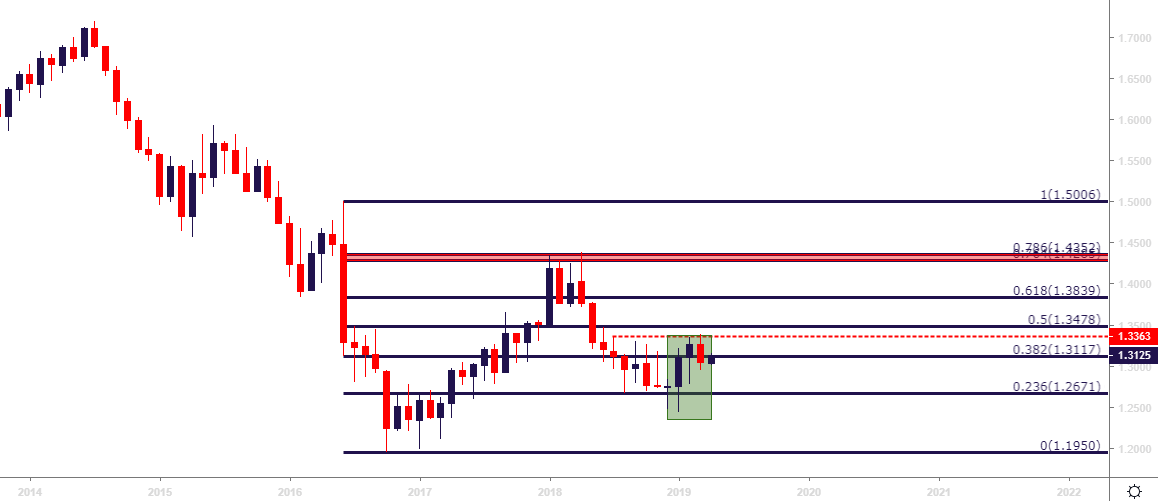
Chart prepared by James Stanley
March Mayhem in GBPUSD
The month of March was especially erratic in GBPUSD, and this theme got an assist from dynamics in the US Dollar to go along with the headline-driven flow from Brexit. After topping-out at the 1.3350 area in the final days of February, GBPUSD moved all the way down to test below the 1.3000 handle in early-March trade. As a bit of Brexit optimism began to show, coupled with a very weak US Dollar, GBPUSD tiled-higher to re-test the 1.3350 area just two weeks after the prior failure; and that, too, brought another push from sellers as the pair went right back down to the 1.3000 area.
Normally, a range of this nature can remain attractive to short-term traders: But the erratic nature with which this has priced-through, combined with the expectation for Brexit dynamics to continue to evoke sharp moves in either direction, has made the prospect of timing turns in GBPUSD incredibly challenging.
GBPUSD Four-Hour Price Chart
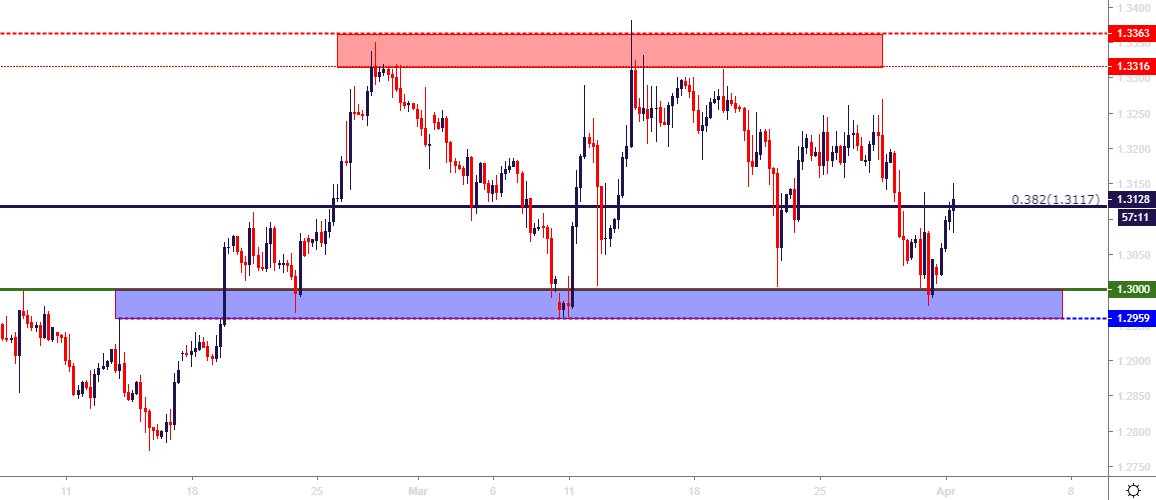
Chart prepared by James Stanley
GBPUSD Longer-Term
In previous technical pieces on GBPUSD, a potential ascending triangle formation was looked at as the horizontal resistance around 1.3350 was coupled with a bullish trend-line sitting underneath price action for 2019 trade, taken from the ‘flash crash’ low on January 3rd and connecting to the mid-February swing-lows.
That formation has now been invalidated after last week’s push below trend-line support. Also of interest, the underside of that trend-line projection now lines up with the 1.3117 level, helping to offer a bit of confluent resistance that’s helping to hold today’s highs.
But – on the other side of the coin, the past three days of price action on the daily chart produce a morning star formation, which will often be approached in a bullish manner. So, there’s a case that can be made on either side of GBPUSD at the moment as taken from the Daily chart.
GBPUSD Daily Price Chart: Morning Star (Non-Complete) Runs into Confluent Resistance

Chart prepared by James Stanley
GBPUSD Short-Term
Shorter-term dynamics in GBPUSD can continue to be a challenge given the expectation for continued noise from Brexit. As discussed in these pieces over the past month, traders approaching the pair in a short-term manner would likely want to focus on risk outlay along with time of exposure given the multitude of twists and turns that have shown around Brexit and, going along with that, GBPUSD.
But, given that the pair has continued to work with pre-defined levels, that context may remain usable for short-term swing traders. The support zone looked at last Wednesday helped to hold the lows, and prices are now bouncing back above the 1.3000-handle, making a move towards the next area of resistance potential that runs around the 1.3187 level. Above that, another zone of resistance potential exists from 1.3231-1.3250 and, above that, 1.3289-1.3300. Underneath current price is a zone that gave a bit of resistance last Friday before that test below 1.3000; and that runs from 1.3087-1.3117, and below that is the 1.2962-1.3000 zone that has held the lows in the pair since late-February.
GBPUSD Two-Hour Price Chart

Chart prepared by James Stanley
To read more:
Are you looking for longer-term analysis on the U.S. Dollar? Our DailyFX Forecasts for Q4 have a section for each major currency, and we also offer a plethora of resources on USD-pairs such as EUR/USD, GBP/USD, USD/JPY, AUD/USD. Traders can also stay up with near-term positioning via our IG Client Sentiment Indicator.
Forex Trading Resources
DailyFX offers an abundance of tools, indicators and resources to help traders. For those looking for trading ideas, our IG Client Sentiment shows the positioning of retail traders with actual live trades and positions. Our trading guides bring our DailyFX Quarterly Forecasts and our Top Trading Opportunities; and our real-time news feed has intra-day interactions from the DailyFX team. And if you’re looking for real-time analysis, our DailyFX Webinars offer numerous sessions each week in which you can see how and why we’re looking at what we’re looking at.
If you’re looking for educational information, our New to FX guide is there to help new(er) traders while our Traits of Successful Traders research is built to help sharpen the skill set by focusing on risk and trade management.
--- Written by James Stanley, Strategist for DailyFX.com
Contact and follow James on Twitter: @JStanleyFX


