


Q2 Price Action Themes in US Dollar, Euro, Gold and Oil
Forex Talking Points:
- If you’re looking to improve your trading approach, our Traits of Successful Traders research could help. This is based on research derived from actual results from real traders, and this is available to any trader completely free-of-charge.
- If you’re looking for a primer on the FX market, we can help. To get a ground-up explanation behind the Forex market, please click here to access our New to FX Trading Guide.
If you’d like to sign up for our webinars, we host an event on Tuesday and Thursday, each of which can be accessed from the below links:
Tuesday: Tuesday, 1PM ET
Thursday: Thursday 1PM ET
US Dollar Rallies as Q2 Open Nears
It’s been a busy month in the US Dollar, but the ascending triangle formation that’s been building for the past few months remains. Prices tested the resistance side of that formation a few weeks ago, just after the ECB rate decision. But the day after that rate meeting brought an abysmal NFP report, and prices soon moved into a week-and-a-half pattern of weakness that saw USD move down to the support side of that formation around FOMC. Since last week’s FOMC, however, prices have been rallying and working-higher within this triangle. This keeps the door open for bullish breakout potential around the currency as the page turns into Q2.
US Dollar Daily Price Chart
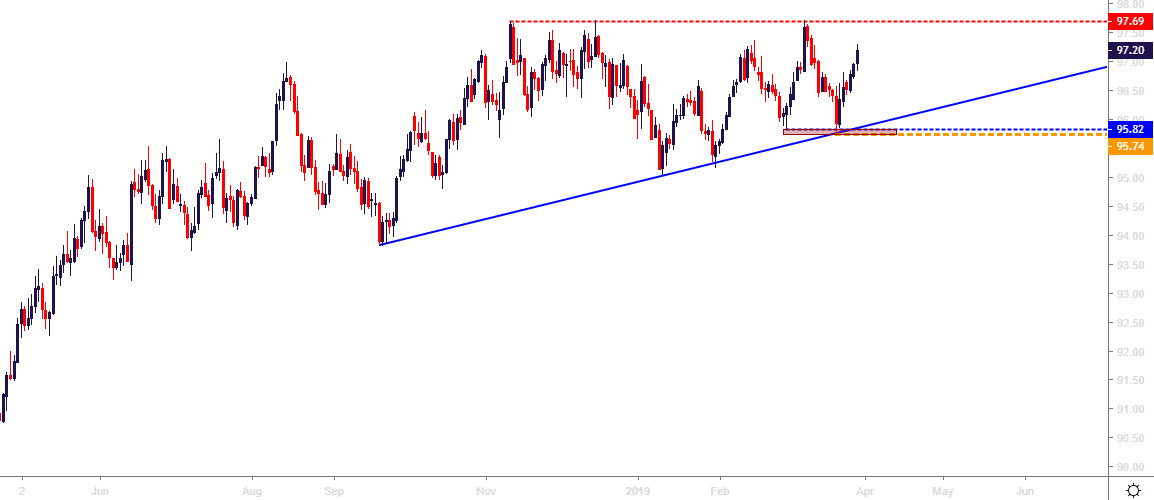
Chart prepared by James Stanley
EURUSD Re-Tests Fib Support: Range Remains Vulnerable
Almost the entirety of Q1 has seen EURUSD stick into the range that built-in during Q4, and there have been a few items of excitement develop around the matter that have yet to be able to compel a directional move. The ECB rate decision earlier in March saw the bank announce another round of stimulus. That gave a few hours of weakness as prices in the pair tip-toed below support, only to catch around the 1.1187 level that’s the 61.8% Fibonacci retracement of the 2017-2018 major move. This lines up with the US Dollar’s resistance inflection at 97.71, and EURUSD strength showed as the Dollar reacted to that resistance.
Around last week’s FOMC rate decision, EURUSD finally ran into its own resistance zone starting around 1.1448, and since then sellers have been back in-charge, pushing prices back down to the 1.1213 Fibonacci level.
Can bears elicit a break-down in Q2? Or will the five-month old range remain?
EURUSD Daily Price Chart

Chart prepared by James Stanley
Gold Price Reverts Back to Prior Support
It’s been a climactic Q1 in Gold, where the Yellow Metal continued to hard-charge in the bullish trend upon the open of the new year. Price action eventually began to top-out around the mid-point of the quarter, and after a return to the 1276-1285 support zone, another bullish wave appeared. I had looked at topside breakouts in Gold earlier this month, and that played-out around last week’s FOMC rate decision. But as USD-strength has come roaring back, Gold bears have gotten active again and the 1276-1285.
A hold of support here keeps the door open for bullish strategies while a break-down below will likely go along with continued USD-strength.
Gold Daily Price Chart

Chart prepared by James Stanley
Crude Oil as a Macro Battle for Q2
I had looked at Oil on Tuesday and remarked on resistance at the $60 level, pointing attention to the potential for a tweet from President Trump to push prices-lower. That took place earlier today and prices moved down for a quick test of support. But this is unlikely to be a smooth bearish trend, as other parties have interest pointing in the opposite direction, and this may provide a near-term show of support that can keep ranges in-play until, eventually, a directional move begins to show. For now- that $60 level remains as resistance and this can be an interesting area to investigate targets for topside plays. Underneath price action – short-term support is around 58.33 and a bit deeper is a prior zone of resistance that can function as support from 57.47-57.85.
Crude Oil Four-Hour Price Chart

Chart prepared by James Stanley
To read more:
Are you looking for longer-term analysis on the U.S. Dollar? Our DailyFX Forecasts for Q4 have a section for each major currency, and we also offer a plethora of resources on USD-pairs such as EUR/USD, GBP/USD, USD/JPY, AUD/USD. Traders can also stay up with near-term positioning via our IG Client Sentiment Indicator.
Forex Trading Resources
DailyFX offers an abundance of tools, indicators and resources to help traders. For those looking for trading ideas, our IG Client Sentiment shows the positioning of retail traders with actual live trades and positions. Our trading guides bring our DailyFX Quarterly Forecasts and our Top Trading Opportunities; and our real-time news feed has intra-day interactions from the DailyFX team. And if you’re looking for real-time analysis, our DailyFX Webinars offer numerous sessions each week in which you can see how and why we’re looking at what we’re looking at.
If you’re looking for educational information, our New to FX guide is there to help new(er) traders while our Traits of Successful Traders research is built to help sharpen the skill set by focusing on risk and trade management.
--- Written by James Stanley, Strategist for DailyFX.com
Contact and follow James on Twitter: @JStanleyFX


