


GBPUSD Talking Points:
- GBPUSD remains in the descending triangle formation and prices have continued to hold resistance around last week’s highs, taken from the 38.2% retracement of the ‘Brexit move’ at 1.3117.
- GBPUSD has been digesting in this formation for over a month now after setting a fresh high on March 13th. But the GBPUSD support zone around the 1.3000 psychological level has continued to hold the lows, leading to a descending triangle formation.
- DailyFX Forecasts are published on a variety of currencies such as the US Dollar or the Euro and are available from the DailyFX Trading Guides page. If you’re looking to improve your trading approach, check out Traits of Successful Traders. And if you’re looking for an introductory primer to the Forex market, check out our New to FX Guide.
Do you want to see how retail traders are currently trading GBPUSD? Check out our IG Client Sentiment Indicator.
GBPUSD Coils Deeper into Digestion
As a number of FX markets continue to coil, the British Pound has not been immune. The chaotic month of March has led into a digestion type of start for April trade in the currency, and against the US Dollar, GBPUSD continues to coil deeper within a descending triangle formation.
GBPUSD Price Four-Hour Chart

Chart prepared by James Stanley
As looked at a couple of weeks ago, a revisit to the key support zone in GBPUSD that runs from 1.2962-1.3000 re-opened the door for topside strategies; and prices in GBPUSD spent most of last week working-higher, eventually finding resistance at a Fibonacci level at the price of 1.3117. This is the 38.2% retracement of the ‘Brexit move’ in the pair, and since last Tuesday – this has marked near-term resistance in GBPUSD.
GBPUSD Price Two-Hour Chart

Chart prepared by James Stanley
GBPUSD Price Drives Deeper into Digestion
Taking a step back, and GBPUSD remains in the descending triangle, with the 1.2962-1.3000 zone hold the lows that have printed since late-February. Resistance is coming from a descending trend-line taken from late-March swing highs. Such a formation will often be approached in a bearish fashion, with the expectation that the same motivation that’s driven in sellers at lower-highs will, eventually, carry-through for a breakdown below horizontal support.
GBPUSD Price Eight-Hour Chart

Chart prepared by James Stanley
GBPUSD Retail Sentiment: Retail Betting on a Hold of Support
Retail traders are continuing to hold a net long position in GBPUSD, with the two out of three retail traders holding long positions in the pair. This is likely driven-by an expectation for the support inflection from a couple of weeks ago to continue to hold.
But – retail positioning is often looked to as a contrarian indicator, begging the question, is GBPUSD nearing a breakdown below support?
Do you want to see how retail traders are currently trading GBPUSD? Check out our IG Client Sentiment Indicator.
GBPUSD IG Client Sentiment: More than Two out of Three Retail Traders Are Long

Chart prepared by James Stanley
GBPUSD Near-Term Strategy
At this stage, the descending triangle pattern is likely well-known. Meaning traders should stay vigilant for false breaks, and as looked at in this week’s FX Setups, price action in GBPUSD could technically break-above the descending trend-line while continuing to carry a bearish posture. This places emphasis on the zone of resistance potential that’s held the April highs. This comes from a confluent area on the chart from 1.3181-1.3187, with the latter of those prices functioning as the 23.6% Fibonacci retracement of the 2014-2016 major move in GBPUSD. A hold of resistance at-or-around this level keeps the door open for short-side approaches.
For those looking at bullish strategies in the pair, traders would likely want to await a break-above 1.3200 to move-forwards with confidence that bulls are taking the reins. Alternatively, a revisit to and hold of support around the 1.2962-1.3000 zone could re-open the door for continued mean-reversion.
GBPUSD Price Hourly Chart
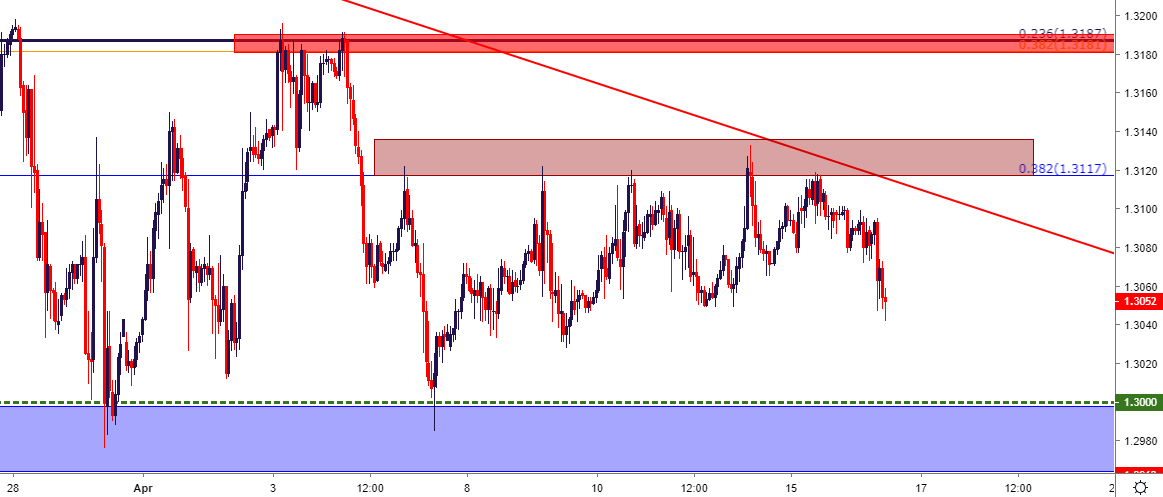
Chart prepared by James Stanley
To read more:
Are you looking for longer-term analysis on the U.S. Dollar? Our DailyFX Forecasts have a section for each major currency, and we also offer a plethora of resources on USD-pairs such as EUR/USD, GBP/USD, USD/JPY, AUD/USD. Traders can also stay up with near-term positioning via our IG Client Sentiment Indicator.
Forex Trading Resources
DailyFX offers an abundance of tools, indicators and resources to help traders. For those looking for trading ideas, our IG Client Sentiment shows the positioning of retail traders with actual live trades and positions. Our trading guides bring our DailyFX Quarterly Forecasts and our Top Trading Opportunities; and our real-time news feed has intra-day interactions from the DailyFX team. And if you’re looking for real-time analysis, our DailyFX Webinars offer numerous sessions each week in which you can see how and why we’re looking at what we’re looking at.
If you’re looking for educational information, our New to FX guide is there to help new(er) traders while our Traits of Successful Traders research is built to help sharpen the skill set by focusing on risk and trade management.
--- Written by James Stanley, Strategist for DailyFX.com
Contact and follow James on Twitter: @JStanleyFX


