


GBP, GBPUSD, British Pound Talking Points:
- The British Pound has rallied this week with GBP/USD making a strong push from a key area of support that’s now held the lows for almost two months. While Brexit headlines continue to drive volatility in the pair, prices have been caught in a bout of mean-reversion for the past month. Breakouts may soon be nearing, in one direction or the other.
- GBPUSD and the descending triangle in the pair appears to have a link to the longer-term ascending triangle in the US Dollar. For Cable to break-below this key zone of support, a bullish move in the US Dollar will likely be needed but, the big question is whether USD bulls can pose that push in the face of a more-dovish FOMC.
- DailyFX Forecasts are published on a variety of currencies such as the US Dollar or the Euro and are available from the DailyFX Trading Guides page. If you’re looking to improve your trading approach, check out Traits of Successful Traders. And if you’re looking for an introductory primer to the Forex market, check out our New to FX Guide.
Do you want to see how retail traders are currently trading GBPUSD? Check out our IG Client Sentiment Indicator.
GBPUSD Bounces from Key Support, Approaches Bearish Trend-Line
It’s been a relatively quiet start to Q2 for the British Pound, and this comes after a month of March that saw a rather aggressive bout of two-sided volatility. But, given the general tone of strength in the currency from January and February, GBP closed out Q1 as one of the strongest currencies in the quarter, even with all of the mayhem taking place around Brexit.
As looked at coming into this week, GBPUSD has continued to hold a key zone of support around the psychological level of 1.3000. The zone around that level, running from the February and March swing lows around 1.2962, as now held the lows for almost two full months as some big fundamental themes have been playing out in the Pound. But – as also noted in this week’s FX Setups, the lower-highs that have built-in over the past month produce a descending trend-line that, when taken with horizontal support, makes for a descending triangle formation in the pair.
GBPUSD Four-Hour Price Chart
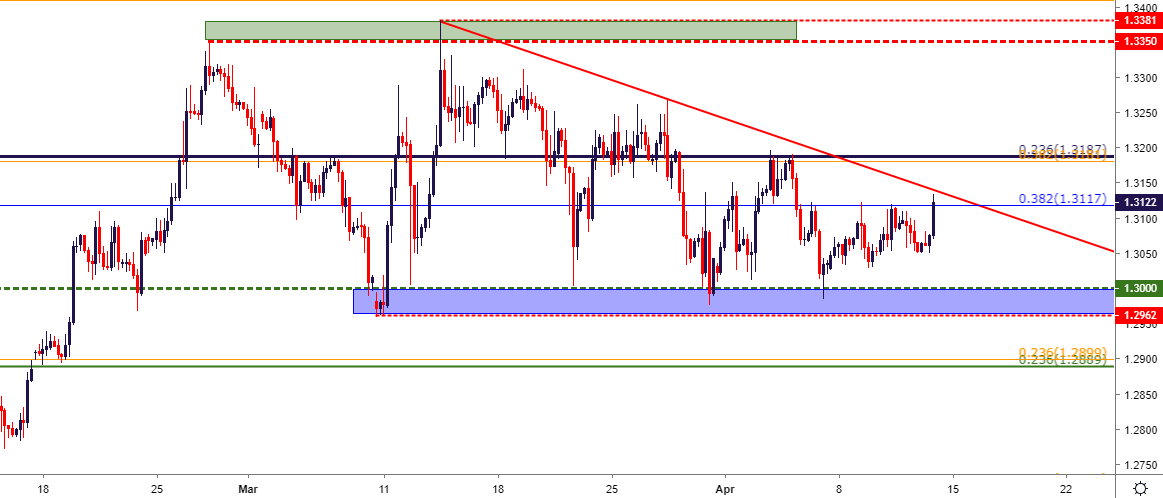
Chart prepared by James Stanley
The formation looked at above will often be approached in a bearish manner, as traders look for the motivation that’s driven-in bears at lower-highs to, eventually, take-over at the horizontal level of support. And as looked at in this week’s FX Setups, traders could look to bullish short-term strategies until the bottom side of that formation was taken-out; and given the backdrop in the US Dollar, there appears to be a link between the US Dollar’s longer-term ascending triangle and the GBPUSD shorter-term descending triangle.
To really propel that down-side break in GBPUSD, US Dollar bulls will likely need to make a push beyond 97.71. This is not to say that a downside break could not be provoked by dynamics around GBP, as news of a No-Deal Brexit may create that bearish break which could, eventually, drive the Dollar through resistance, allowing for the British Pound to lead the way in the realization of both of those themes.
But for now, that prospect remains a bit more distant as the support bounce in GBPUSD has continued to play out through this week. At this point, GBPUSD is testing short-term resistance at the 1.3117 Fibonacci level, which is the 38.2% retracement of the ‘Brexit move’ in the pair. Price action is fast-approaching the trend-line which sets resistance in the descending triangle formation.
GBPUSD Two-Hour Price Chart
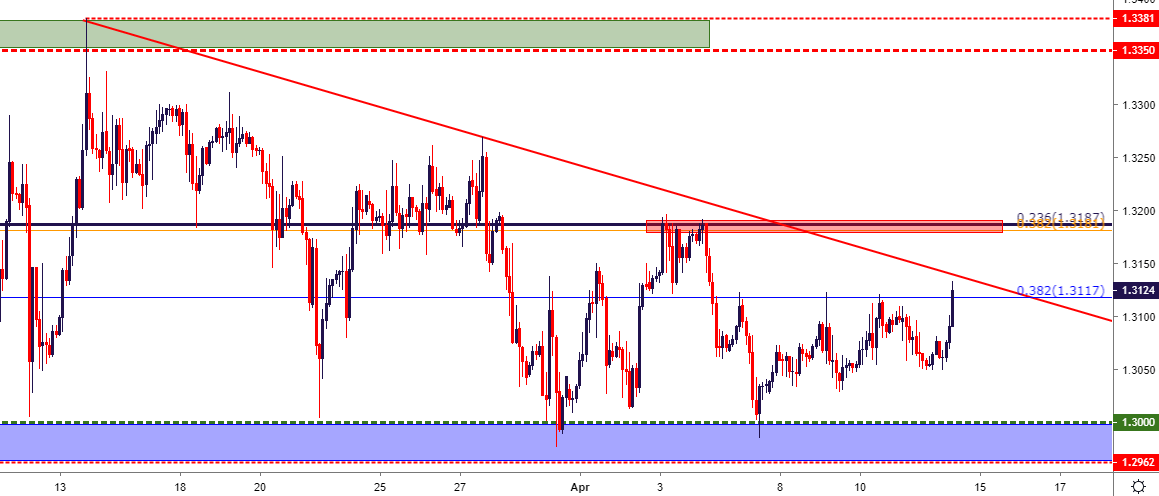
Chart prepared by James Stanley
GBPUSD Strategy Moving Forward
At this point, the ‘big picture’ potential for bearish breakouts appears to remain linked to either bullish USD breakouts of the longer-term ascending triangle. Or, some element of surprise around Brexit where a No-Deal Brexit becomes more likely. At this point, it does not appear as though market participants are betting on either of those outcomes – so this keeps focus on near-term levels in order to incorporate the near-term volatility into shorter-term swing strategies.
If prices are able to test above the bearish trend-line, another key zone of resistance lurks above, and this runs from 1.3181-1.3187. This is the same zone that held the highs last week as a considerable amount of grind showed on short-term charts, followed by that trip back down to 1.3000. Short-side strategies could be investigated on a resistance test in this area.
For bullish strategies in the pair – traders would likely want to wait for a re-test of the support zone around 1.3000. Alternatively, if bulls are able to continue pushing in the early-portion of next week, a bullish break beyond 1.3200 may re-open the door for such a theme; but traders would likely want to approach that scenario with a bit of patience as the propensity for noise remains very high in GBP.
To read more:
Are you looking for longer-term analysis on the U.S. Dollar? Our DailyFX Forecasts have a section for each major currency, and we also offer a plethora of resources on USD-pairs such as EUR/USD, GBP/USD, USD/JPY, AUD/USD. Traders can also stay up with near-term positioning via our IG Client Sentiment Indicator.
Forex Trading Resources
DailyFX offers an abundance of tools, indicators and resources to help traders. For those looking for trading ideas, our IG Client Sentiment shows the positioning of retail traders with actual live trades and positions. Our trading guides bring our DailyFX Quarterly Forecasts and our Top Trading Opportunities; and our real-time news feed has intra-day interactions from the DailyFX team. And if you’re looking for real-time analysis, our DailyFX Webinars offer numerous sessions each week in which you can see how and why we’re looking at what we’re looking at.
If you’re looking for educational information, our New to FX guide is there to help new(er) traders while our Traits of Successful Traders research is built to help sharpen the skill set by focusing on risk and trade management.
--- Written by James Stanley, Strategist for DailyFX.com
Contact and follow James on Twitter: @JStanleyFX


