


EURUSD, GBPUSD and USDJPY Talking Points:
- The US Dollar has done very little since yesterday’s release of FOMC meeting minutes, holding support around the 96.90 level and seeing a small bounce ahead of the US open.
- In a number of major pairs, digestion-based setups could offer near-term potential with USD themes. In EUR/USD, the pair has stumbled after bouncing from a key area of support earlier this week. GBP/USD, on the other hand, is holding support at a key area as a descending triangle has built. And in USD/JPY, the pair is showing an inverse head and shoulders pattern, which may be pointing to bullish breakout potential in the pair.
- DailyFX Forecasts are published on a variety of currencies such as the US Dollar or the Euro and are available from the DailyFX Trading Guides page. If you’re looking to improve your trading approach, check out Traits of Successful Traders. And if you’re looking for an introductory primer to the Forex market, check out our New to FX Guide.
Do you want to see how retail traders are currently trading Gold prices? Check out our IG Client Sentiment Indicator.
US Dollar Meanders After FOMC Minutes
US Dollar price action has been rather unexciting in the aftermath of yesterday’s release of FOMC meeting minutes. After posing a mild bearish move around the release, support set-in around the 96.90 level with the currency catching a bump-higher as the US open neared. This keeps the currency in a non-directional short-term pattern: Just below current prices remains support potential around the 96.68 and 96.47 levels, the latter of which is the 23.6% Fibonacci retracement of the 2011-2017 major move. Atop price action, resistance potential exists at the 97.21-97.30 zone that helped to catch yesterday’s high, followed by a trend-line projection that currently plots around the April swing high of 97.47. Beyond that is the yearly high at 97.71, which has now turned-around three different bullish advances in the currency since last November.
US Dollar Four-Hour Price Chart
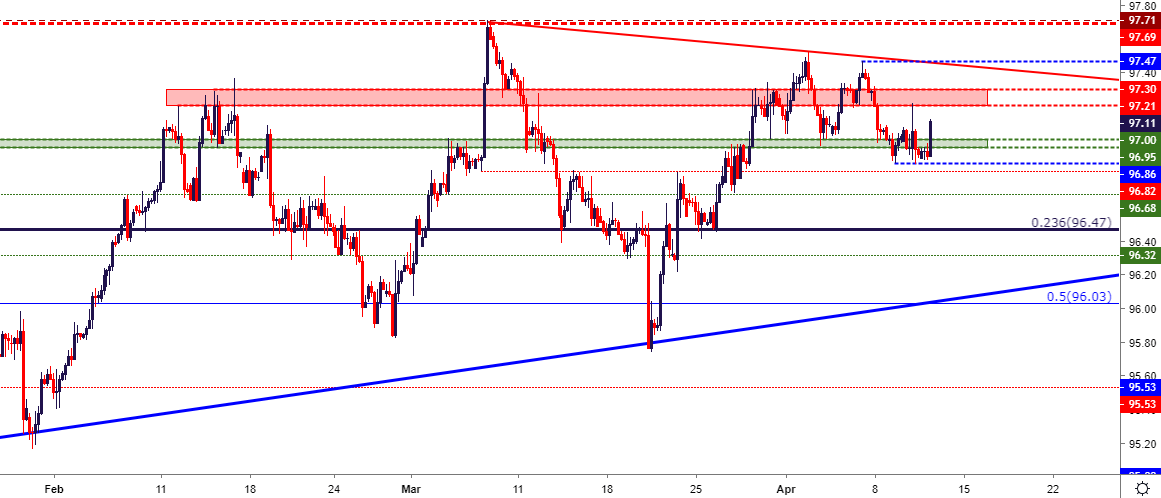
Chart prepared by James Stanley
EURUSD Struggles Ahead of 1.1300 Re-Test, Builds Rising Wedge
Going along with that meandering US Dollar has been a messy outlay in EURUSD. The pair posed a quick bearish move around yesterday’s ECB press conference; but that was short-lived as prices soon ran right back to their pre-release levels. And 24 hours later, price action remains in this area as neither bulls nor bears have been able to take control of the matter.
This can make for a difficult time to line up long positions with the expectation of range continuation, particularly given the lack of buying pressure that’s shown as the 1.1300 level has come near.
On the other side of EUR/USD, short-term bearish strategies may soon become attractive. The April support bounce has built into a rising wedge pattern, which will often be approached with the aim of bearish reversals. That, combined with short-term resistance at prior support, can re-open the door to re-tests of the 1.1187-1.1212 zone.
EURUSD Four-Hour Price Chart
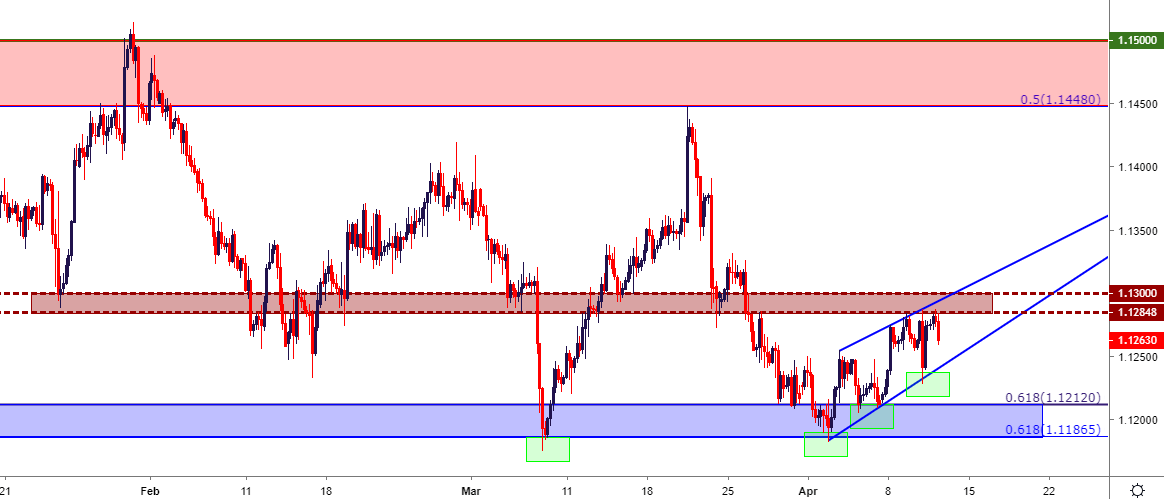
Chart prepared by James Stanley
GBPUSD Holds 1.3000 Support, Builds Descending Triangle
In GBP/USD, the pair has been relatively quiet considering the fireworks from early-March. But as looked at last week, prices started to put-in bearish cues with a break below a bullish trend-line that had held the lows for the bulk of 2019 trade.
Since then, support has built-in around the 1.2962-1.3000 zone, and when combined with a bearish trend-line taken off of the March swing highs builds a descending triangle formation. This is a pattern that will often be approached in a bearish fashion, driven by the expectation that’s driven bears in at lower-highs will, eventually, carry over for a break of the horizontal support. As looked at in this week’s FX Setups, the next area of support around the 1.2900-handle can remain as attractive for next stops of support.
GBPUSD Four-Hour Price Chart
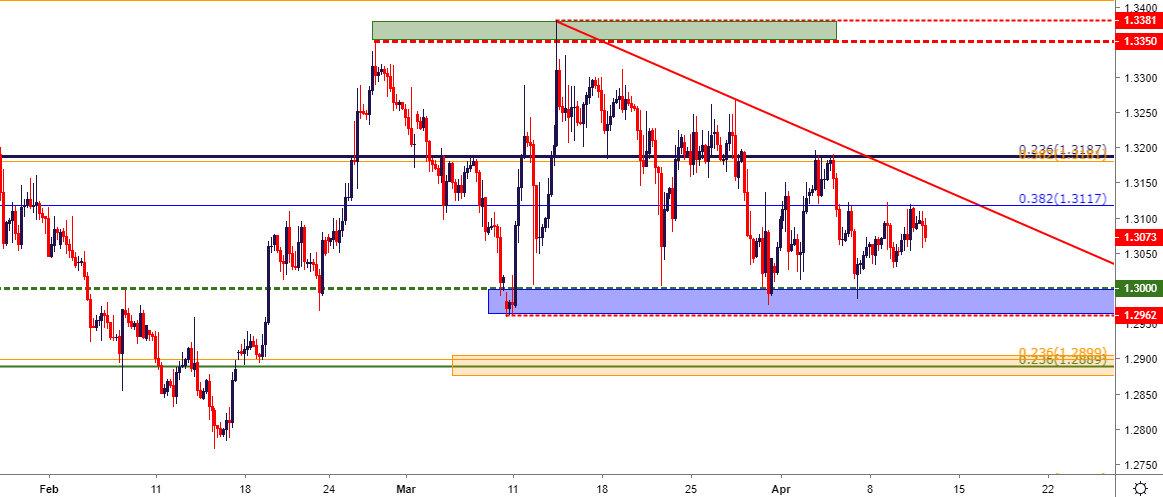
Chart prepared by James Stanley
USDJPY Bounces From Support, Builds Inverse Head and Shoulders
The digestion in USDJPY has continued and the pair is continuing its support bounce from the 110.75-110.86 zone looked at in Tuesday’s webinar. At this point, the pair is brewing an inverse head and shoulders pattern with a neckline just inside of the 112.00-handle.
Given the amount of resistance that’s built in this region over the past month-and-change highlights the potential for bullish breakouts should 112.00 come back into play. A bullish breakout from an inverse head and shoulders pattern, combined with the early-March grind keeps this as a very interesting level of resistance in the pair. Also of consideration, USDJPY has tracked risk-trends fairly well, with bullish themes showing as US equities have ripped higher through the bulk of Q1. Given that yesterday’s FOMC minutes did not show that hawkish drive that many were fearing, this could also point to topside potential in USDJPY as we trade deeper into Q1.
USDJPY Four-Hour Price Chart
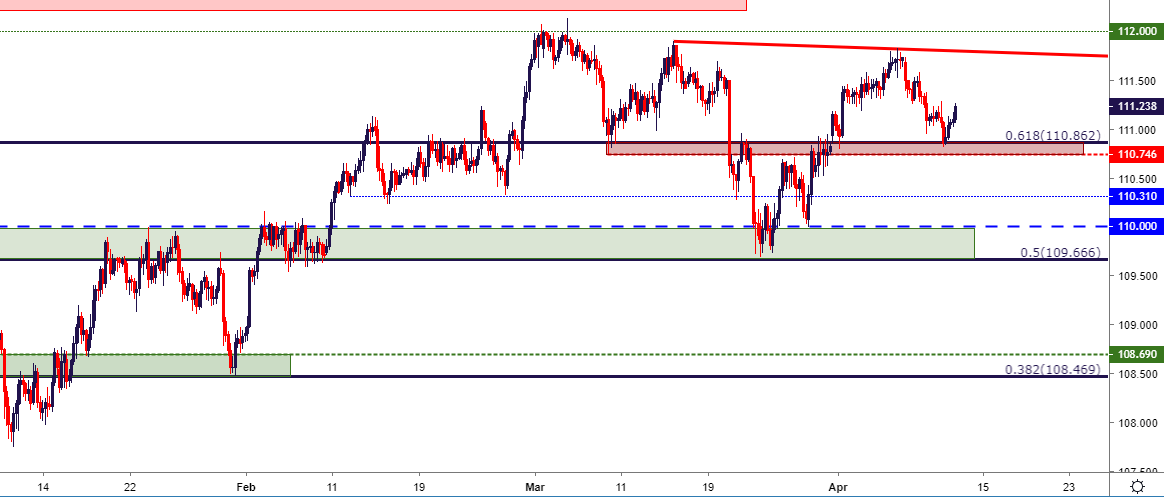
Chart prepared by James Stanley
To read more:
Are you looking for longer-term analysis on the U.S. Dollar? Our DailyFX Forecasts for Q2 have a section for each major currency, and we also offer a plethora of resources on USD-pairs such as EUR/USD, GBP/USD, USD/JPY, AUD/USD. Traders can also stay up with near-term positioning via our IG Client Sentiment Indicator.
Forex Trading Resources
DailyFX offers an abundance of tools, indicators and resources to help traders. For those looking for trading ideas, our IG Client Sentiment shows the positioning of retail traders with actual live trades and positions. Our trading guides bring our DailyFX Quarterly Forecasts and our Top Trading Opportunities; and our real-time news feed has intra-day interactions from the DailyFX team. And if you’re looking for real-time analysis, our DailyFX Webinars offer numerous sessions each week in which you can see how and why we’re looking at what we’re looking at.
If you’re looking for educational information, our New to FX guide is there to help new(er) traders while our Traits of Successful Traders research is built to help sharpen the skill set by focusing on risk and trade management.
--- Written by James Stanley, Strategist for DailyFX.com
Contact and follow James on Twitter: @JStanleyFX


