


Forex Talking Points:
- DailyFX Quarterly Forecasts for Q2 have been recently released, and are available directly from the following link: DailyFX Trading Guides, Q2 Forecasts.
- For trading ideas, please check out our Trading Guides. And if you’re looking for something more interactive in nature, please check out our DailyFX Live webinars.
- If you’d like more color around any of the setups below, join in our live DailyFX webinars each week, set for Tuesday and Thursday at 1PM Eastern Time. You can sign up for each of those sessions from the below link:
Tuesday: Tuesday, 1PM ET
Thursday: Thursday 1PM ET
Do you want to see how retail traders are currently trading the US Dollar? Check out our IG Client Sentiment Indicator.
EURUSD: Support Bounce Builds Bullish Channel – Bear Flag Potential
In the latter-portion of last week, matters didn’t look very positive for the Euro. EURUSD had started to re-test a key zone of support in the opening days of Q2, and a considerable amount of grind developed in this area last week. But, as looked at in FX Setups, this kept the door open for bullish strategies in EURUSD with the expectation for the multi-month range to hold, and both targets were met as buyers pushed-higher after the ECB/FOMC Minutes releases on Wednesday of this week.
At this point, that support bounce has built into a bullish channel, and given the prior bearish move, this could be called a bear flag formation. This would be a shorter-term observation in the midst of a longer-term range; and this sets a fairly interesting table for short-term strategies around EURUSD.
For next week, bullish short-term potential remains, looking for prices to hold higher-low support above the 1.1280-1.1300 area that exhibited resistance on Thursday. A hold of support here through the Monday open keeps the potential for prices to test deeper within the longer-term range formation, targeting 1.1400 and then 1.1448.
EURUSD Two-Hour Price Chart
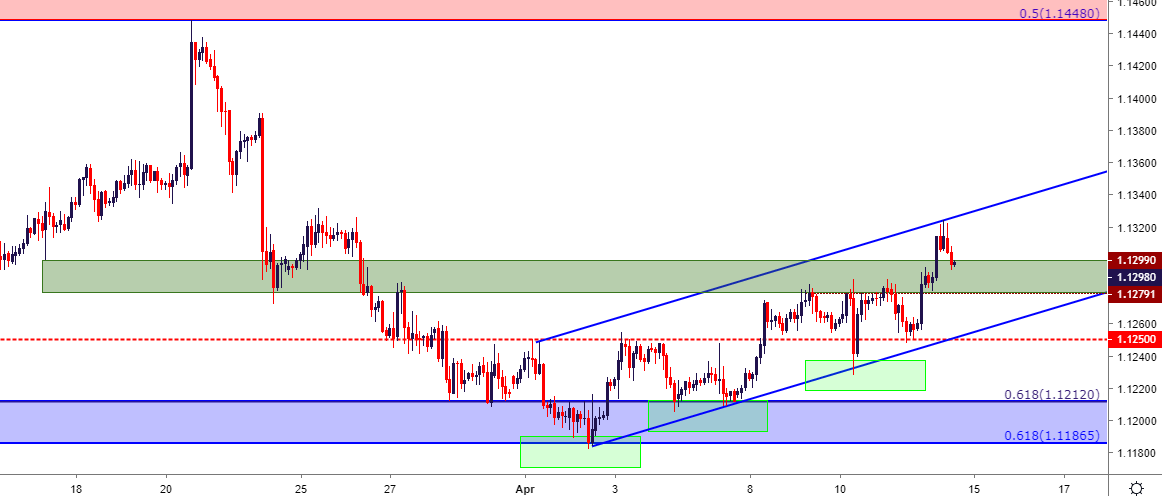
For short-strategies, there are a few possible ways of moving forward. The first, and bigger-picture approach, would be looking for a break of range support around the 1.1175 level that was looked at last week. Alternatively, should buyers remain in-control long enough to allow for an inflection at range resistance, from 1.1448 up to 1.1500, the short-side theme can re-open for range continuation. And for traders with shorter-term approaches that do want to look for a bear flag break, a push below the 1.1250 level could re-open the door for support tests at 1.1212, followed by 1.1187, and perhaps even a bearish breakout below the 1.1175 level that’s currently marking the 21-month low in the pair.
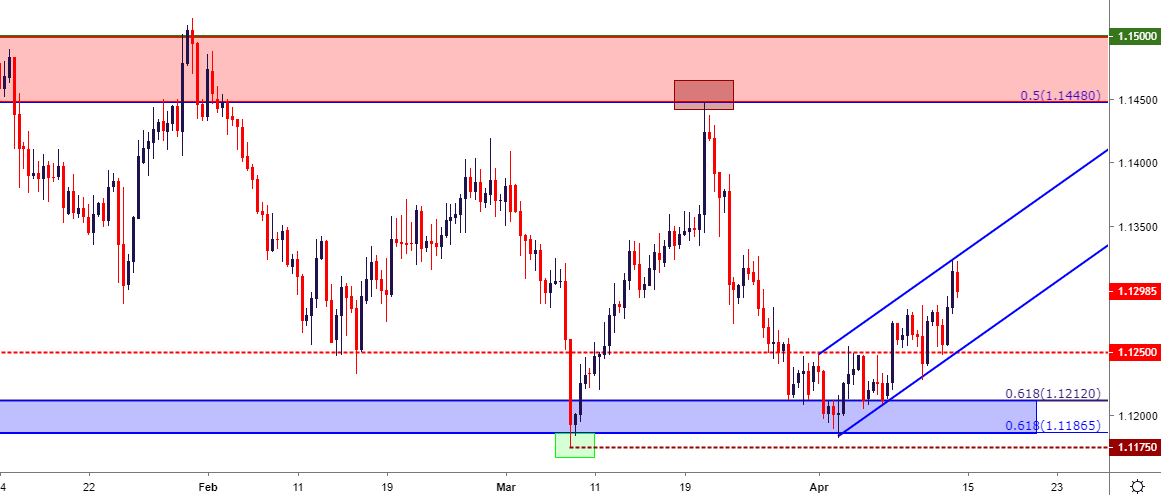
EURUSD Eight-Hour Price Chart
GBPUSD: Bearish Potential Below 1.3200
A similar setup had presented itself in GBPUSD last week, in which longer-term support was helping to hold the lows in the midst of a shorter-term case of digestion.
GBP/USD closed last week after yet another test of the 1.2962-1.3000 support zone. This marks the fourth separate iteration of support tests in this zone since mid-February, and that support has held up through some rather aggressive fundamental themes. But, also as seen in EURUSD above, bearish potential remained should that support give way, and in terms of the British Pound, this equated to a descending triangle formation when incorporating that horizontal support with a trend-line taken from lower-highs produced in March.
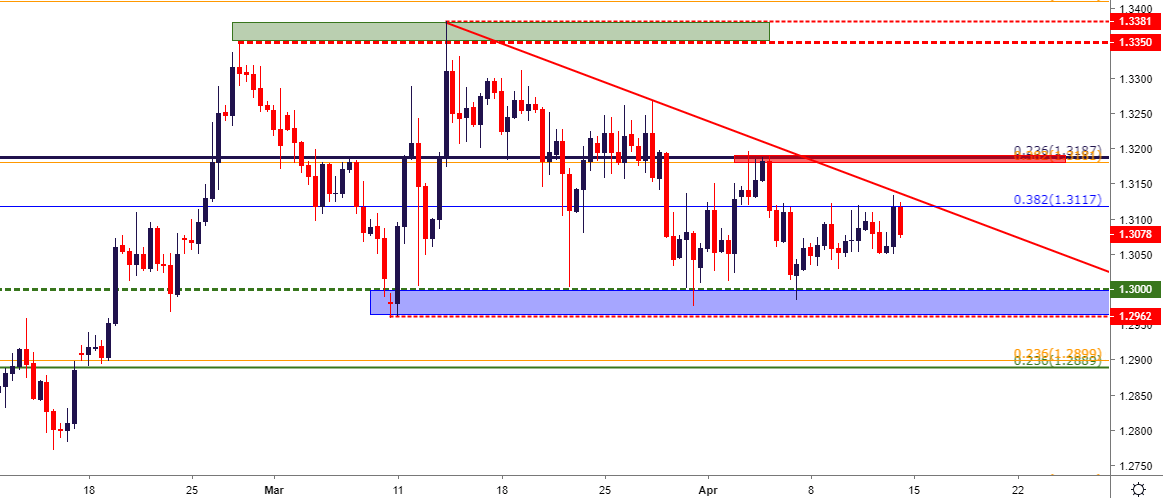
For next week, I want to look at bearish strategies in the pair and I’m even willing to accept a topside break of that bearish trend-line; instead focusing in on the confluent zone of Fibonacci resistance that previously held the April swing-highs. This takes place from 1.3181-1.3187; and a hold of resistance at-or-below this zone early next week keeps the door open for short-side strategies in the pair. Initial targets could be sought out at 1.3035, followed by the big zone of support that runs from 1.2962-1.3000; and if bears can pose a downside push, then the longer-term descending triangle will be filling-in, at which point additional short-side targets could be sought out around the 1.2900 zone.
GBPUSD Four-Hour Price Chart
USD/JPY Potential Bullish Breakout on Build of Inverse Head and Shoulders
I had focused-in on this one in the Thursday webinar as themes of Yen-weakness have re-appeared with prominence in the early days of Q2. USD/JPY had built into an inverse head-and-shoulders pattern, and as I shared there, traders would likely want to look at the resistance level around 112.00 before staging longer-term bullish strategies.
That area has come back into play as USD/JPY makes a push towards fresh 2019 highs. For next week, this theme can remain as attractive; but entry may remain as a challenge given that the breakout has already started to take place.
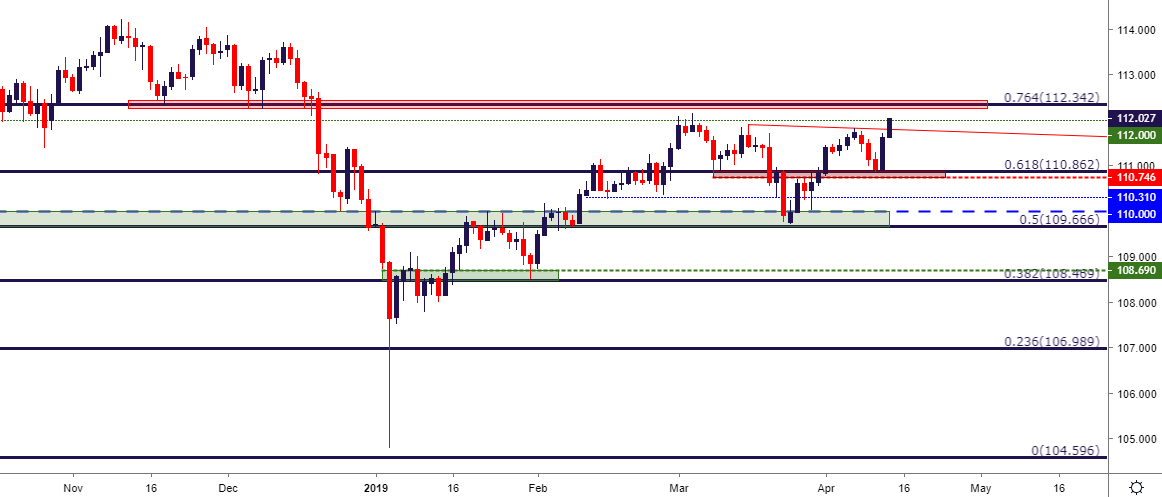
Traders can look for resistance a little higher at a key level on the chart of 112.34. This is the 76.4% retracement of the November, 2017 to March, 2018 major move; and this level has already functioned as support over a month in Q4, when it helped to set the swing-low just before the big bout of risk aversion showed up in the Yen. This Fibonacci study has also been usable through 2019 trade, with all of the 38.2, 50, and 61.8% retracements functioning as resistance-turned-support.
USD/JPY Daily Price Chart
A resistance test at this level can open the door for an element of higher-low support, and that could keep the door open for bullish trend continuation strategies. For higher-low support after a 112.34 test, traders can look to the 111.50 level that produced a short-term evening star earlier this week, extended up to last week’s swing-high at 111.81. A second possible area remains for support should a pullback drive through that first zone, and this runs from 111.13 up to 111.29. IF prices are unable to hold above the 110.86 area that marks this week’s swing low, the bullish near-term theme in USDJPY would be invalidated.
USD/JPY Two-Hour Price Chart

USDCAD: Bearish on Hold Below 1.3450
I had looked at the short-side of USD/CAD coming into this week, largely predicated on the basis of resistance holding at a big zone of long-term interest. That resistance has held through this week’s trade, keeping the door open for short-side strategies in the pair. This could fit especially well with themes or strategies based around USD-weakness, with the expectation that the longer-term ascending triangle in USD may take some time to fill-in.
In USD/CAD, a revisit to the resistance zone that runs from 1.3161-1.3185 opens the door for short-side swings, with target potential around 1.3300 followed by 1.3250.
USDCAD Four-Hour Price Chart
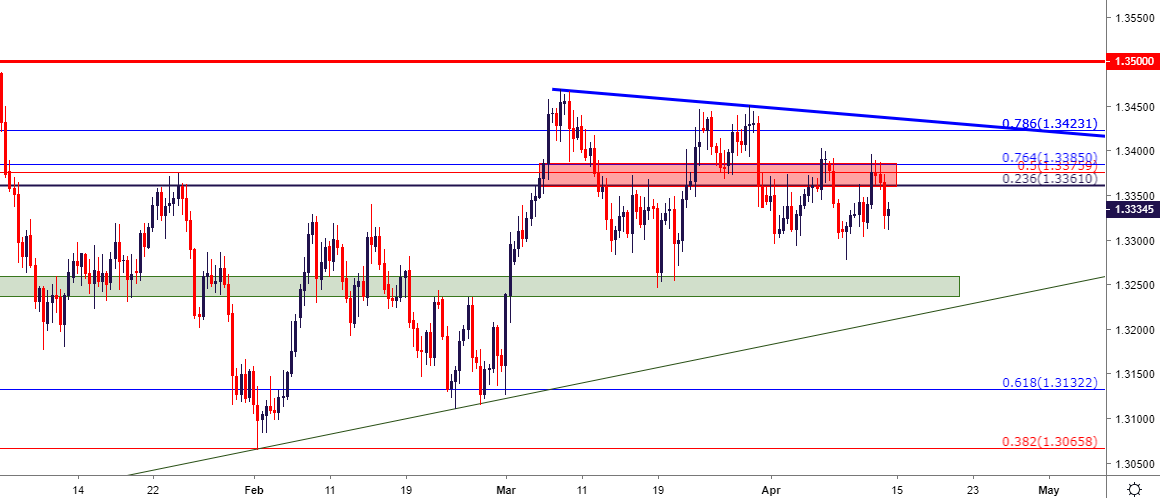
Chart prepared by James Stanley
To read more:
Are you looking for longer-term analysis on the U.S. Dollar? Our DailyFX Forecasts have a section for each major currency, and we also offer a plethora of resources on USD-pairs such as EUR/USD, GBP/USD, USD/JPY, AUD/USD. Traders can also stay up with near-term positioning via our IG Client Sentiment Indicator.
Forex Trading Resources
DailyFX offers a plethora of tools, indicators and resources to help traders. For those looking for trading ideas, our IG Client Sentiment shows the positioning of retail traders with actual live trades and positions. Our trading guides bring our DailyFX Quarterly Forecasts and our Top Trading Opportunities; and our real-time news feed has intra-day interactions from the DailyFX team. And if you’re looking for real-time analysis, our DailyFX Webinars offer numerous sessions each week in which you can see how and why we’re looking at what we’re looking at.
If you’re looking for educational information, our New to FX guide is there to help new(er) traders while our Traits of Successful Traders research is built to help sharpen the skill set by focusing on risk and trade management.
--- Written by James Stanley, Strategist for DailyFX.com
Contact and follow James on Twitter: @JStanleyFX


