


Forex Talking Points:
- If you’re looking to improve your trading approach, our Traits of Successful Traders research could help. This is based on research derived from actual results from real traders, and this is available to any trader completely free-of-charge.
- If you’re looking for a primer on the FX market, we can help. To get a ground-up explanation behind the Forex market, please click here to access our New to FX Trading Guide.
If you’d like to sign up for our webinars, we host an event on Tuesday and Thursday, each of which can be accessed from the below links:
Tuesday: Tuesday, 1PM ET
Thursday: Thursday 1PM ET
FX Market Remains with Congestion and Range After ECB, FOMC Minutes
Yesterday’s excitement quickly gave way to a return of middling price action, as both the Euro and US Dollar remain near pre-release levels without much potential showing for near-term directional trends. Next week’s economic calendar is rather mild with only a handful of data announcements, the high point of which appears to be inflation releases out of New Zealand (Tuesday) the UK, Canada (both on Wednesday) and Japan (Thursday evening).
In this webinar, I looked at setups across the US Dollar, focusing in on both short and long-term backdrops.
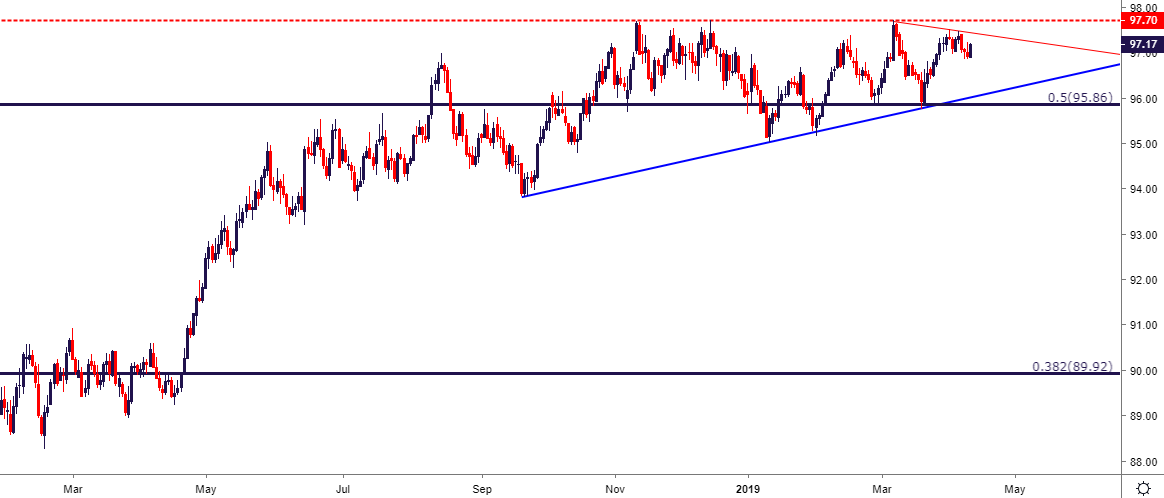
US Dollar Remains in Ascending Triangle – May Need a Support Push
The US Dollar has seen buyers shy away from a re-test of the yearly high at 97.70, with last week’s price action producing a lower-high in that theme. And while this certainly doesn’t negate the bullish potential in the USD, it does point to the fact that this theme will likely need a push of some kind to bring that bullish breakout beyond 97.71. What might that push be? It’s looking increasingly less-likely that it will come from the Fed as the bank appears to be comfortably dovish after the March rate decision.
US Dollar Daily Price Chart
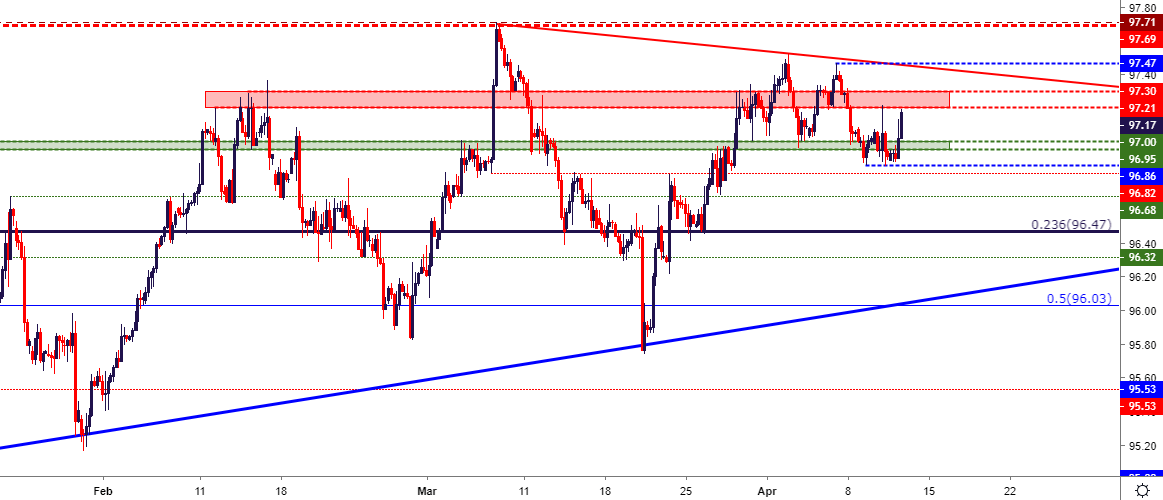
Near-term, this puts focus on support structure in the US Dollar with the potential for a continued downdraft. This week saw a lower-low build around the 96.85 area, and below that remains support potential around 96.68 and 96.47, which is a big-picture Fibonacci level taken from the 2011-2017 major move in the currency. Below that is an area of confluence, running between the 96.03 Fibonacci level and the bullish trend-line.
US Dollar Four-Hour Price Chart
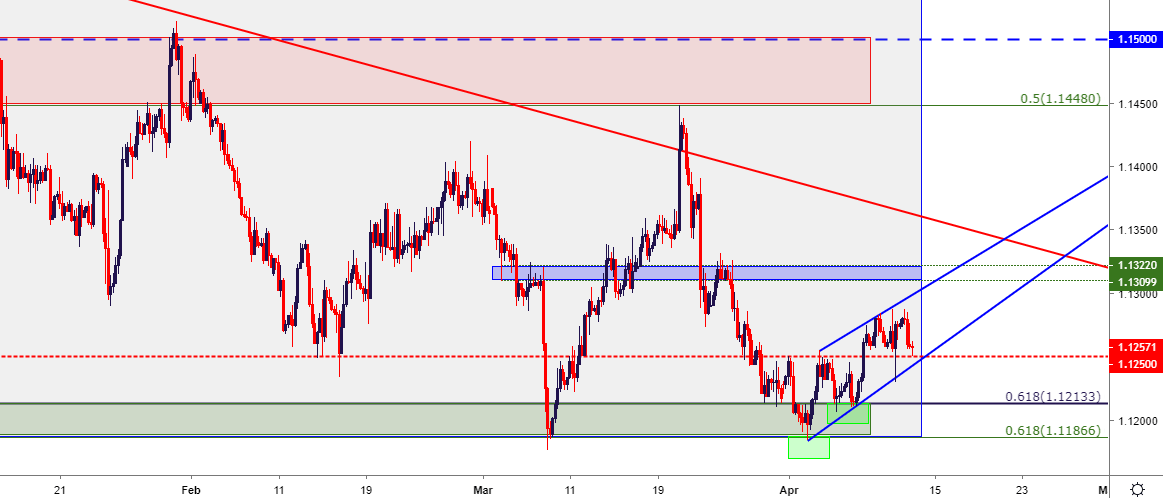
Euro Support Bounce Builds Rising Wedge
On a longer-term basis, EURUSD remains in the range that’s been in-play since November.
EURUSD Daily Price Chart

Near-term, the bullish response to that support may be soon meeting its end. I had looked at the bullish side of the pair coming into this week, and that theme has remained visible through yesterday’s ECB and FOMC minutes drivers. But, the fact that buyers have been much more active around lows than highs shows that this bullish move may not have much room left. Key for this theme will be a test below the 1.1250 psychological level.
EURUSD Two-Hour Price Chart
GBPUSD Builds Descending Triangle
It was a surprisingly strong Q1 for the British Pound, and that even includes some aggressive two-way volatility that showed-up in March. During that pensive period in the Pound, the currency carved-in support around the 1.2962-1.3000 zone. But, after topping-out in mid-March, the pair has been setting a series of lower-highs, making up the resistance side of that formation. This will often be approached in a bearish manner, looking for the motivation that’s driven-in bears at lower-highs to, eventually, take-over to allow for a break-below horizontal support.
GBPUSD Four-Hour Price Chart

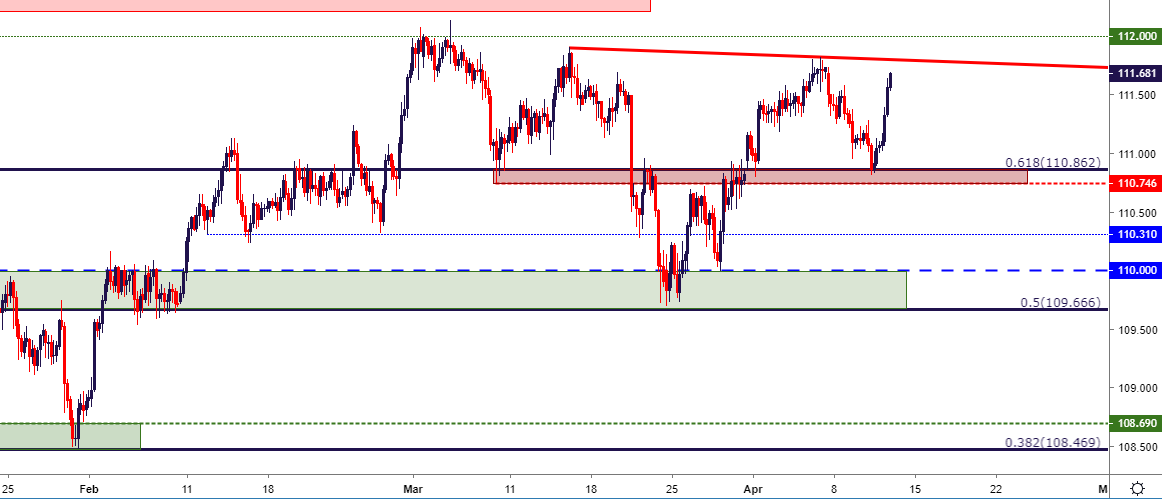
USDJPY Builds Inverse Head and Shoulders: Breakout Nearing?
I had discussed USDJPY in this morning’s write-up, focusing on a rather clear bullish response to a key zone of support that runs from 110.75-110.86. This places emphasis on a bearish trend-line that can be found from the mid-March and early-April swing highs: A bullish break through that level can open the door for additional topside in the pair. Just beyond the 112.00 level that helped to mark the 2019 high is a Fibonacci level at 112.34, and that can function as an initial target or an area for break-even stop moves.
USDJPY Four-Hour Price Chart
USDCHF Reversal Potential May be Nearing
USD/CHF has broken above the potential area of resistance around the parity figure. This now opens the door for resistance in the area that helped to catch a couple of recent tops in the pair, and this runs from 1.0071-1.0096.
USDCHF Daily Price Chart

USDCAD Back to Resistance
This morning’s US Dollar strength has helped USDCAD to recover, and prices are right back into the zone of resistance looked at coming into this week. This can keep the door open for short-side USD strategies in the pair.
USDCAD Four-Hour Price Chart

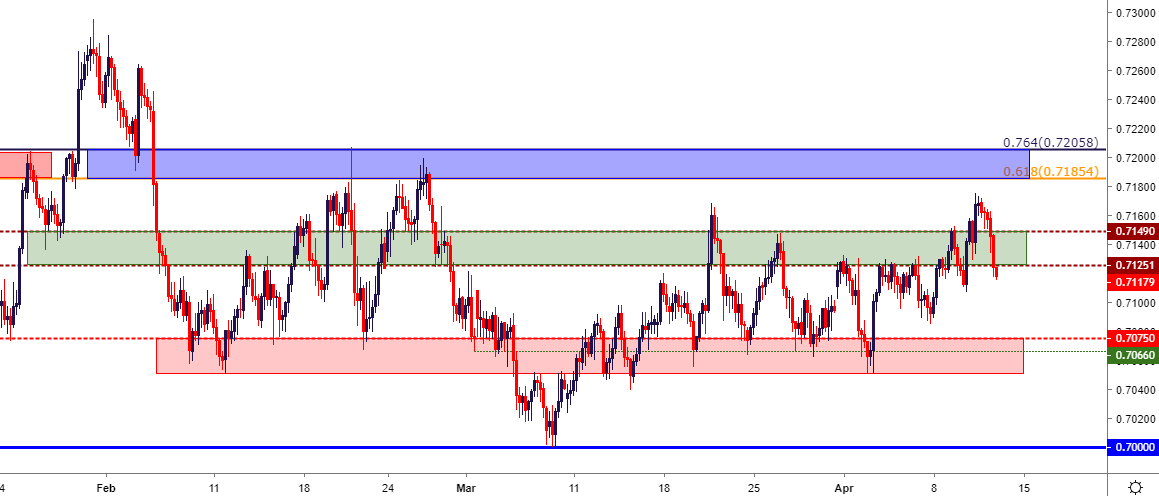
AUDUSD Longer-Term Resistance Lurks Ahead
AUDUSD continues to work within the confines of the multi-month range, but with prices budging above the ‘R1’ zone looked at earlier this week, focus is on the ‘R2’ zone for a re-test. That zone runs from Fibonacci levels at .7186-.7205.
AUDUSD Four-Hour Price Chart
NZDUSD: Higher-Low Support Potential
NZDUSD has re-tested a key Fibonacci level on the chart at .6717, which is currently helping to mark the two-month low in the pair. If buyers can hold prices above this level, allowing for the build of a higher-low, bullish reversal strategies may soon come back into favor.
NZDUSD Eight-Hour Price Chart

Gold Prices React at Resistance – Support Watch is On
On the short-side of the US Dollar, bullish Gold scenarios can remain as attractive. Gold has continued to build support in a key zone through 2019 trade, which runs from the approximate 1275-1286. With prices pushing lower from the resistance looked at earlier this week, the door is re-opening for another support test in the pair, which can go along well with continued themes of meander or pressure in the US Dollar.
Gold Price Four-Hour Price Chart

Chart prepared by James Stanley
To read more:
Are you looking for longer-term analysis on the U.S. Dollar? Our DailyFX Forecasts for Q4 have a section for each major currency, and we also offer a plethora of resources on USD-pairs such as EUR/USD, GBP/USD, USD/JPY, AUD/USD. Traders can also stay up with near-term positioning via our IG Client Sentiment Indicator.
Forex Trading Resources
DailyFX offers an abundance of tools, indicators and resources to help traders. For those looking for trading ideas, our IG Client Sentiment shows the positioning of retail traders with actual live trades and positions. Our trading guides bring our DailyFX Quarterly Forecasts and our Top Trading Opportunities; and our real-time news feed has intra-day interactions from the DailyFX team. And if you’re looking for real-time analysis, our DailyFX Webinars offer numerous sessions each week in which you can see how and why we’re looking at what we’re looking at.
If you’re looking for educational information, our New to FX guide is there to help new(er) traders while our Traits of Successful Traders research is built to help sharpen the skill set by focusing on risk and trade management.
--- Written by James Stanley, Strategist for DailyFX.com
Contact and follow James on Twitter: @JStanleyFX


