


Aussie, AUDUSD, AUDJPY Talking Points:
- It’s been a range-bound type of year for the Australian Dollar, but 2019 did not start that way as the currency experienced a ‘flash crash’ in the opening days of this year’s trade. Since then, however, a bit of consistency has developed in AUDUSD and AUDJPY markets, and range setups in AUDUSD were part of this week’s FX Setups of the Week.
- The range in AUDJPY is probably more well-defined than that of AUDUSD; but given the US Dollar’s current pullback from what’s been a generally strong year of trade, there may be a bit more attention focusing on the major pair. But – for traders that do want to look at long-USD strategies ahead of tomorrow’s ECB and FOMC Meeting Minutes drivers, the short-side of AUDUSD can be attractive.
- DailyFX Forecasts are published on a variety of currencies such as the US Dollar or the Euro and are available from the DailyFX Trading Guides page. If you’re looking to improve your trading approach, check out Traits of Successful Traders. And if you’re looking for an introductory primer to the Forex market, check out our New to FX Guide.
Do you want to see how retail traders are currently trading the US Dollar? Check out our IG Client Sentiment Indicator.
Aussie Goes From Flash Crash to Model of Consistency
It was a troubling start to the year for the Australian Dollar as the currency experienced what many classified as a ‘flash crash’ in the opening days of 2019 trade. A combination of factors, key of which was the hold-over of risk aversion themes from Q4, combined to push AUDUSD below the psychologically-important .7000 level, and AUDJPY dropped down to a fresh nine-and-a-half year low, hitting levels that haven’t been tested since June of 2009.
But since then – a different tone has developed as an initial recovery from that early-year sell-off built into consistent ranges, and those have now held over the past couple of months.
While many traders, especially retail traders, will often lament the lack of volatility that’s been present through most of 2019 trade in the FX market, ranges can remain particularly attractive to experienced traders, due in large part to the consistency shown and the prospect of well-defined risk management. If a range is going to continue, prices should stay below resistance – offering a rather clear-cut case of where stops should be investigated so that if the range doesn’t hold, loss mitigation can be prioritized.
AUDUSD Eight-Hour Price Chart
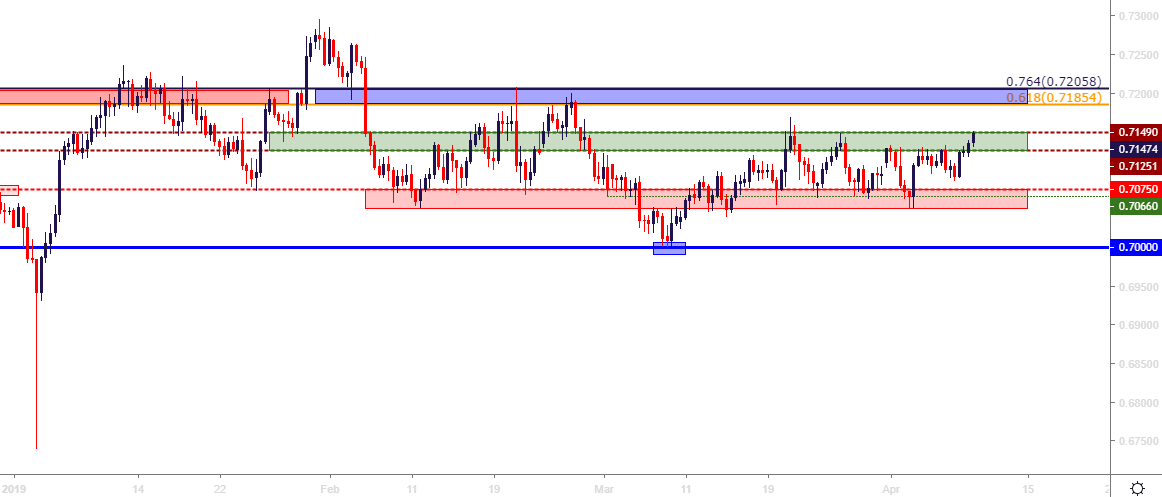
Chart prepared by James Stanley
The Range in AUD/USD
While it’s been a strong showing so far in 2019 for the US Dollar, AUDUSD turned that initial spike below the .7000 handle into a relatively tight range that’s continued to hold for two months. There are two supports and two resistance areas in this theme, with the .7000 psychological level seeing a test in early-March that turned-around a bearish advance. Just above that is a zone that runs from .7050 up to .7075 that’s shown a tendency for support; while the resistance side has an initial zone from .7125-.7150 and a bit-higher is the area that held the late-February highs that runs from .7185-.7205.
AUDUSD Four-Hour Price Chart
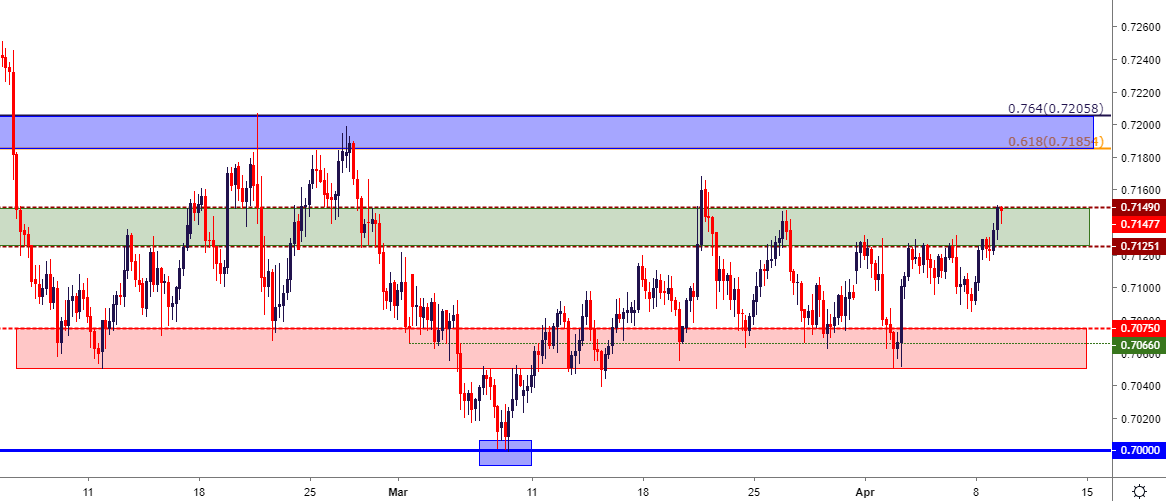
Chart prepared by James Stanley
As can be seen in the above chart, prices are currently testing the topside of the first resistance zone at .7150, and this was the same level that held the highs a couple of weeks ago. For traders that wanted to investigate bullish-USD strategies ahead of tomorrow’s ECB and FOMC Minutes release, this could be a very interesting option; and there are a couple of ways of approaching the matter. Traders can either place stops slightly above this zone of resistance, with the expectation that they may need to re-enter should the deeper zone of resistance come into play around .7185-.7206. Alternatively, traders can go in with an initial stop above that deeper zone; but the wider stop would need to be countered by a larger initial profit target, and that would be an approximate 60-pip outlay, with an initial target set around the topside of support at .7075.
Or, for those that wanted to approach the matter with a bit more patience, focus could remain on that deeper zone, particularly around tomorrow’s FOMC minutes release, to see if a quick-rush of USD-weakness can propel prices up to this area; which could then re-open the door for short-side strategies based on range continuation.
AUDUSD Two-Hour Price Chart
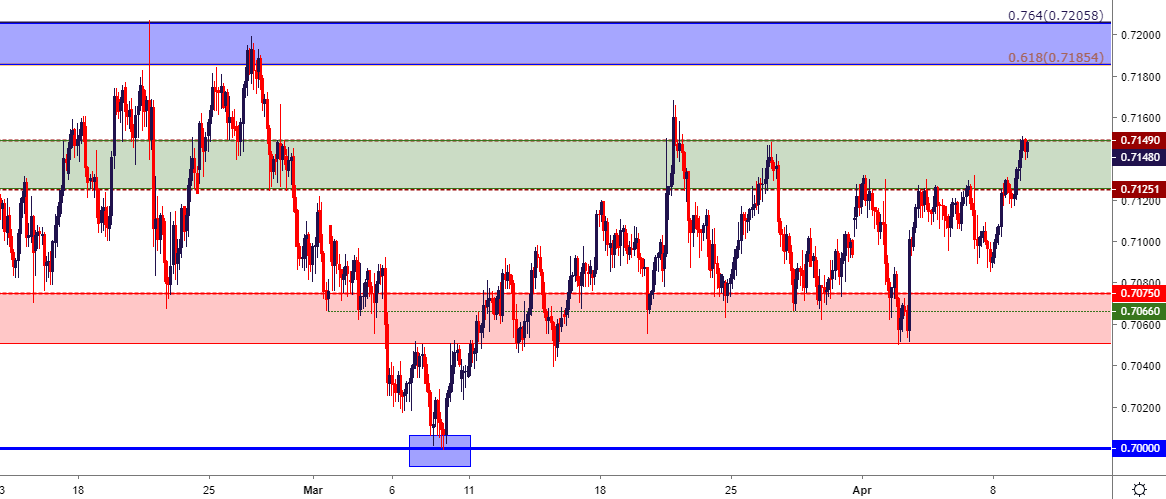
Chart prepared by James Stanley
AUDJPY Moves Back Towards .8000 Big Figure
A similar theme has shown in 2019 in AUDJPY with a touch of additional strength in the pair given the additional weakness that’s shown in the Yen versus the US Dollar. The range in AUDJPY this year may be even more consistent than what’s shown in the AUDUSD major, and the resistance side of this setup has come from a confluent zone of resistance around the 79.68 level up to the .8000-handle; while support has remained around the .7750 psychological level up to .7775.
AUDJPY Eight-Hour Price Chart
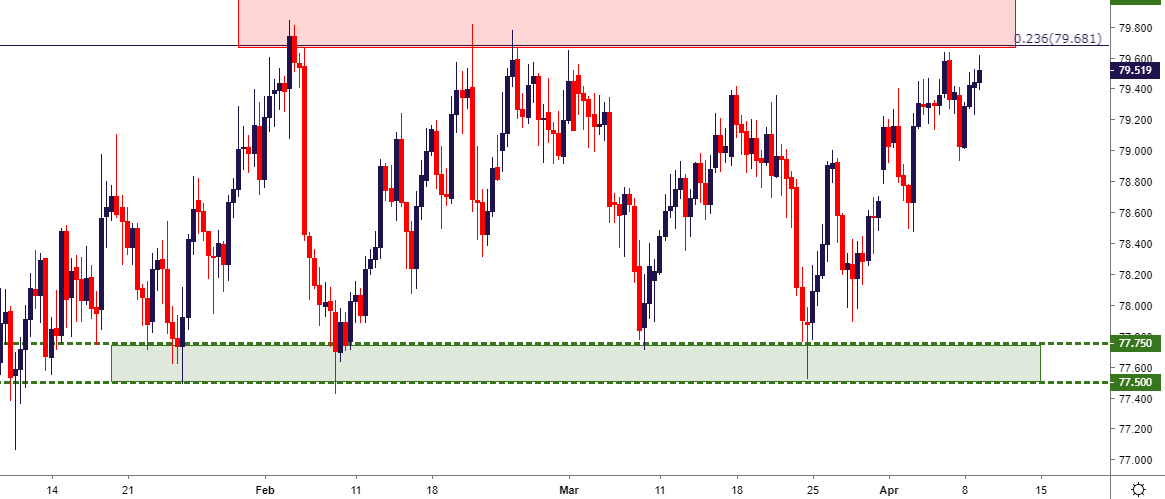
Chart prepared by James Stanley
To read more:
Are you looking for longer-term analysis on the U.S. Dollar? Our DailyFX Forecasts for Q1 have a section for each major currency, and we also offer a plethora of resources on USD-pairs such as EUR/USD, GBP/USD, USD/JPY, AUD/USD. Traders can also stay up with near-term positioning via our IG Client Sentiment Indicator.
Forex Trading Resources
DailyFX offers an abundance of tools, indicators and resources to help traders. For those looking for trading ideas, our IG Client Sentiment shows the positioning of retail traders with actual live trades and positions. Our trading guides bring our DailyFX Quarterly Forecasts and our Top Trading Opportunities; and our real-time news feed has intra-day interactions from the DailyFX team. And if you’re looking for real-time analysis, our DailyFX Webinars offer numerous sessions each week in which you can see how and why we’re looking at what we’re looking at.
If you’re looking for educational information, our New to FX guide is there to help new(er) traders while our Traits of Successful Traders research is built to help sharpen the skill set by focusing on risk and trade management.
--- Written by James Stanley, Strategist for DailyFX.com
Contact and follow James on Twitter: @JStanleyFX


