


Gold Technical Price Forecast: XAU/USD Weekly Trade Levels
- Gold price updated trade levels - Weekly Technical Chart
- XAU/USD breakout of 2022 downtrend underway- initial resistance objectives in view
- Get started with this Free How to Trade Gold -Beginners Guides
Gold prices surged this week with XAU/USD up more than 4.8% to trade at 1762 in early US trade on Friday. The rally marks the largest single-week advance since July 2020 with a breakout of the yearly downtrend threatening a major reversal in the yellow metal. These are the updated targets and invalidation levels that matter on the XAU/USD weekly chart. Review my latest Weekly Strategy Webinar for an in-depth breakdown of this gold technical setup and more.

Gold Price Chart - XAU/USD Weekly

Chart Prepared by Michael Boutros, Technical Strategist; Gold on Tradingview
Notes: In my last Gold Weekly Price Outlook I noted that XAU/USD was, “poised for a possible breakout in the days ahead and the focus is on a weekly close above the 2021 lows. From at trading standpoint, a good place to raise protective stops – look for a reaction on a stretch toward 1791 for guidance.” Gold surged more than 4.6% this week with price now approaching confluent resistance at the January low-week close / 38.2% Fibonacci retracement of the 2022 range at 1788/91- note that the 2018/2019 trendline also converges on this threshold in the weeks ahead with the 52-week moving average just higher near ~1806. A breach / weekly close above this level is needed to suggest a larger trend reversal is underway.
Weekly support now rests back at the yearly low-week close / 2021 swing lows at 1675/77 backed by critical support around the yearly lows at the 2020 March reversal close and the 50% retracement at 1617/31- a break / weekly close below this threshold would threaten resumption of the yearly downtrend towards 1560.
Bottom line: A gold price breakout is underway and the focus is on possible price inflection / exhaustion heading into resistance objective just higher. From a trading standpoint, look to reduce portions of long exposure / raise protective stops on a stretch towards 1800- look for a larger reaction there for guidance. Losses should be limited to 1676 IF price is indeed heading higher here. Keep in mind we have US elections and key inflation data (CPI) on tap- stay nimble here. Review my latest Gold Price Short-term Technical Outlook for a closer look at the near-term XAU/USD trade levels.
For a complete breakdown of Michael’s trading strategy, review his Foundations of Technical Analysis series on Building a Trading Strategy
Gold Trader Sentiment – XAU/USD Price Chart
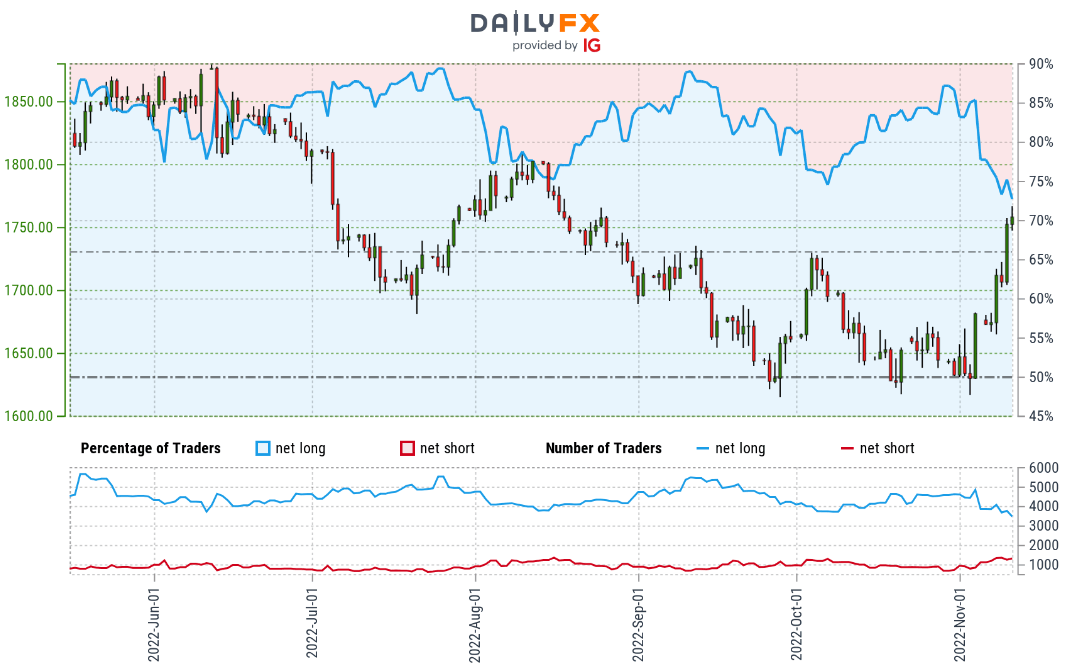
- A summary of IG Client Sentiment shows traders are net-long Gold- the ratio stands at +2.66 (72.70% of traders are long) – typically bearish reading
- Long positions are 7.82% lower than yesterday and 20.35% lower from last week
- Short positions are 1.69% higher than yesterday and 30.74% higher from last week
- We typically take a contrarian view to crowd sentiment, and the fact traders are net-long suggests Gold prices may continue to fall. Yet traders are less net-long than yesterday and compared with last week. Recent changes in sentiment warn that the current Gold price trend may soon reverse higher despite the fact traders remain net-long.
| Change in | Longs | Shorts | OI |
| Daily | 1% | -3% | -1% |
| Weekly | 2% | -8% | -2% |
Silver Price Chart – XAG/USD Weekly
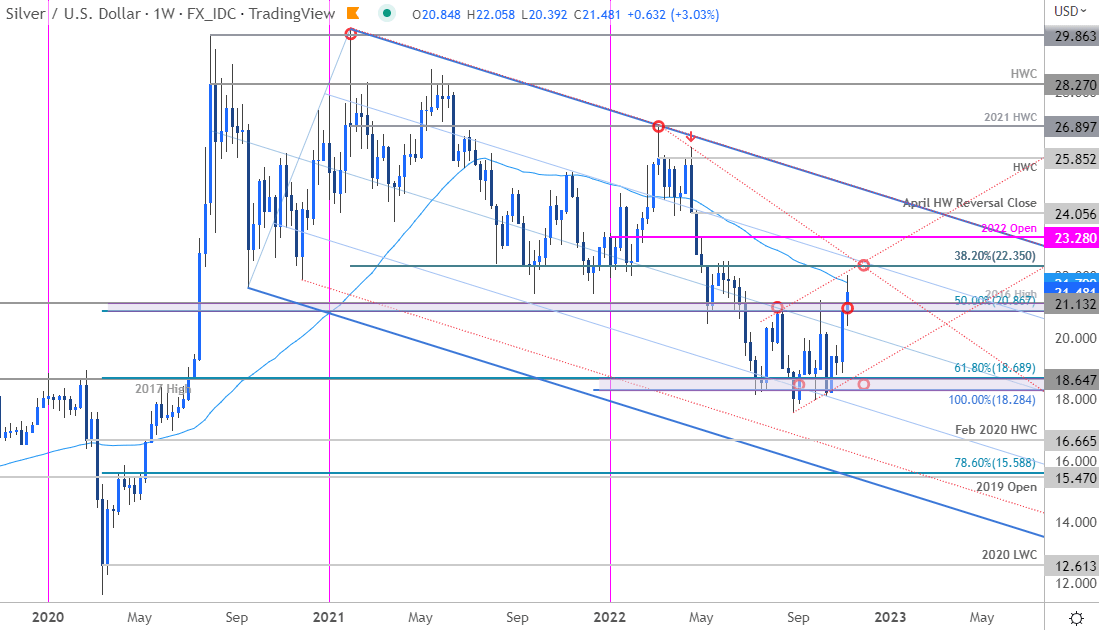
Chart Prepared by Michael Boutros, Technical Strategist; Silver on Tradingview
A similar scenario is unfolding in Silver although the major breakout of the yearly downtrend has not occurred yet. A breach of the August / October monthly highs / resistance at the 50% retracement of the 2020 range and the 2016 swing high takes XAG/USD into the 52-week moving average here at ~21.80 with key resistance just higher at 22.35- a breach / close above needed to suggest a larger reversal is underway here.
A topside breach keeps exposes subsequent objectives at the 2022 yearly open at 23.28 and the April high-week reversal close at 24.05- look for a larger reaction there IF reached. Initial support rests around the median-line (currently ~20.10s) backed by a more significant confluence zone at 18.28/68- weakness beyond this threshold would threaten resumption of the broader downtrend.
Economic Calendar
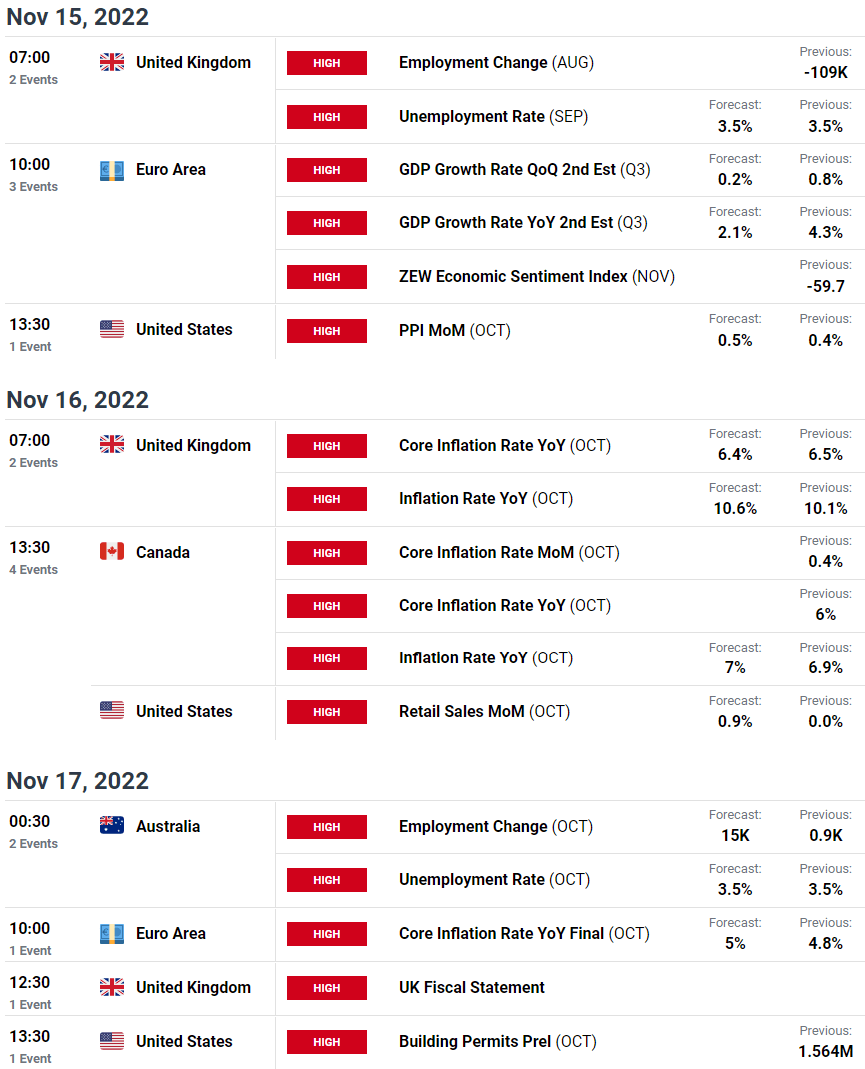
Economic Calendar - latest economic developments and upcoming event risk.
Active Weekly Technical Charts
- US Dollar Index (DXY)
- British Pound (GBP/USD)
- Crude Oil (WTI)
- Canadian Dollar (USD/CAD)
- Japanese Yen (USD/JPY)
- S&P 500, Nasdaq & Dow
- Australian Dollar
- Euro (EUR/USD)
- Japanese Yen (USD/JPY)
- Written by Michael Boutros, Technical Strategist with DailyFX
Follow Michael on Twitter @MBForex


