


Gold Technical Price Outlook: XAU/USD Short-term Trade Levels
- Gold price updated technical trade levels – Daily & Intraday Charts
- XAU/USD rebound off yearly low faces key pivot zone- risk for price inflection
- New to Gold Trading? Get started with this Free How to Trade Gold -Beginners Guide
Gold prices rallied more than 0.3% since the start of the week with XAU/USD building on last week’s defense of the yearly lows. The recovery is on shaky ground as the weekly range contracts below a key pivot zone and recent price action raises the scope for a breakout in the days ahead. These are the updated targets and invalidation levels that matter on the XAU/USD short-term technical charts. Review my latest Strategy Webinar for an in-depth breakdown of this gold technical setup and more.
Gold Price Chart - XAU/USD Daily
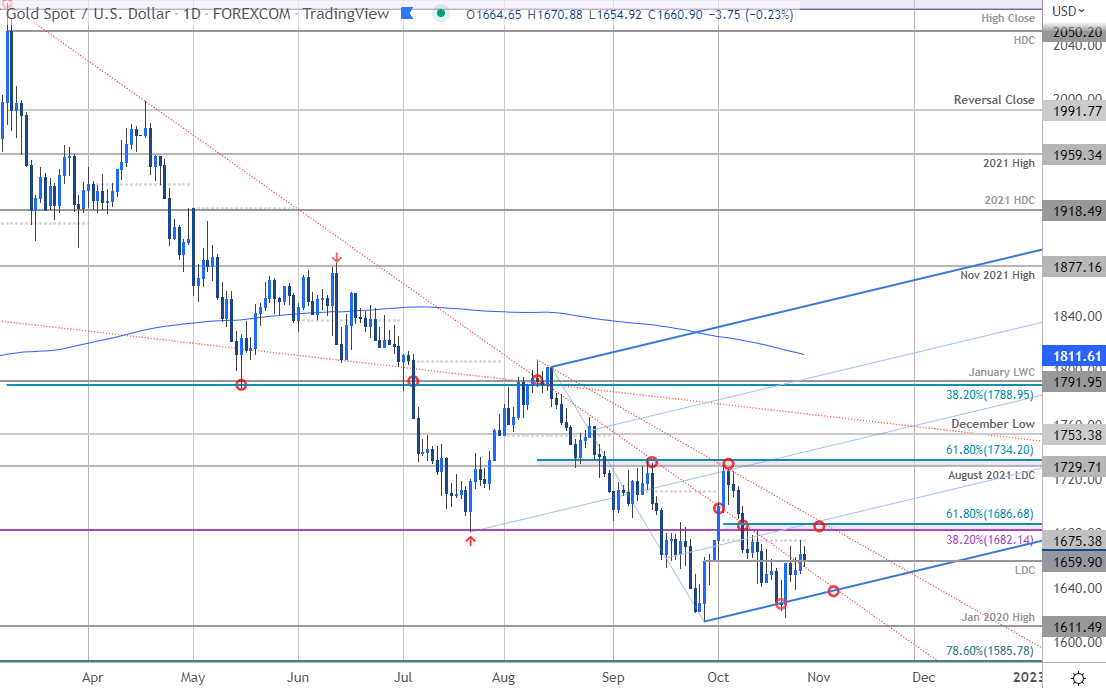
Chart Prepared by Michael Boutros, Technical Strategist; Gold on Tradingview
Technical Outlook: In last week’s Gold Short-term Price Outlook we noted that the XAU/USD was, “at the precipice - today’s lows would need to hold IF price is indeed heading higher with a breach above 1688 needed to suggest a more significant low was registered last month.” A final test of pitchfork support the following day produced a massive outside-day reversal candle with the subsequent rally extending more than 3.5% off the low. The rally was halted yesterday at the objective monthly open with price currently straddling the 2022 low-day close at 1659- is a near-term low in place?
Gold Price Chart - XAU/USD 240min
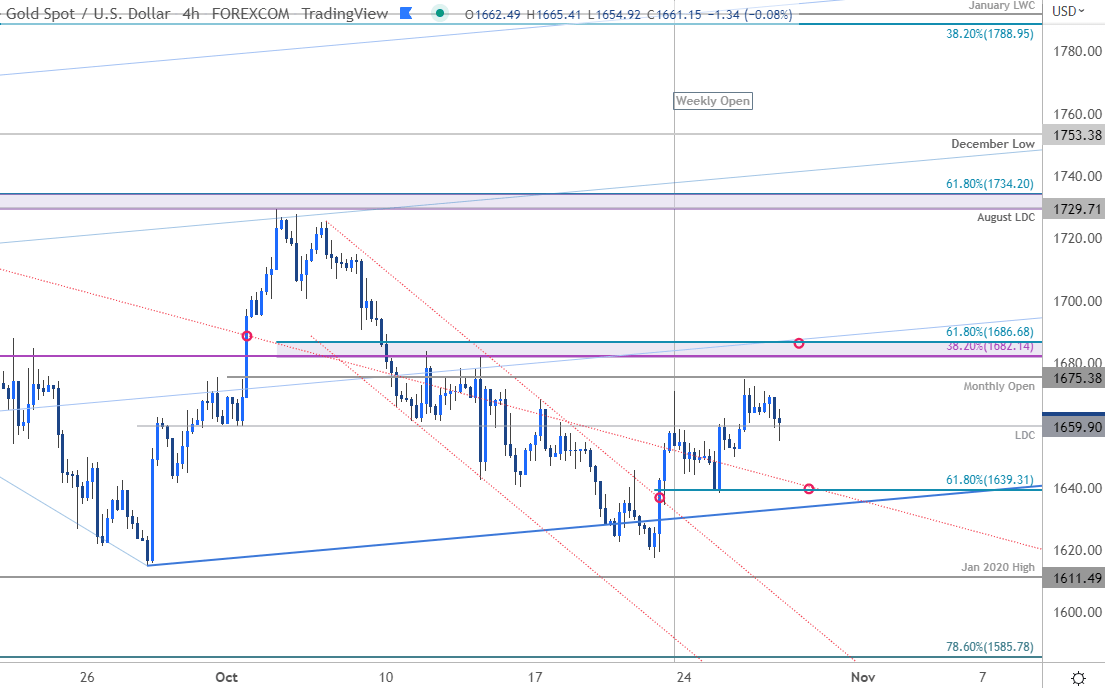
Notes: A closer look at Gold price action shows XAU/USD breaking out of a the descending channel formation highlighted last week with this week’s opening-range taking shape just below the monthly open at 1675. Ultimately, a breach / close above confluent Fibonacci resistance at 1682/86 is needed to suggest a larger reversal may be underway with such a scenario exposing the August low-day close / 61.8% retracement at 1729/34- look for a larger reaction there IF reached.
Initial support rests at the weekly range lows / 61.8% Fibonacci retracement of the Friday rally at 1638/39 with a break / close below the lower parallel needed to mark resumption of the broader downtrend towards the January 2020 high at 1611 and the 78.6% retracement at 1585.

Bottom line: The gold recovery is approaching a key pivot zone and leaves the rally vulnerable into multi-week highs. From a trading standpoint, a good zone to reduce long-exposure / raise protective stops – losses should be limited to the lower parallel IF price is heading higher with a breach / close above 1686 needed to keep the immediate long-bias viable. Keep in mind the key US inflation data (Core PCE) is on tap Friday with the FOMC rate and Non-Farm Payrolls (NFP) slated for next week. Expect volatility and stay nimble into the releases. Review my latest Gold Weekly Price Outlook for a closer look at the longer-term XAU/USD technical trading levels.
For a complete breakdown of Michael’s trading strategy, review his Foundations of Technical Analysis series on Building a Trading Strategy
Gold Trader Sentiment – XAU/USD Price Chart
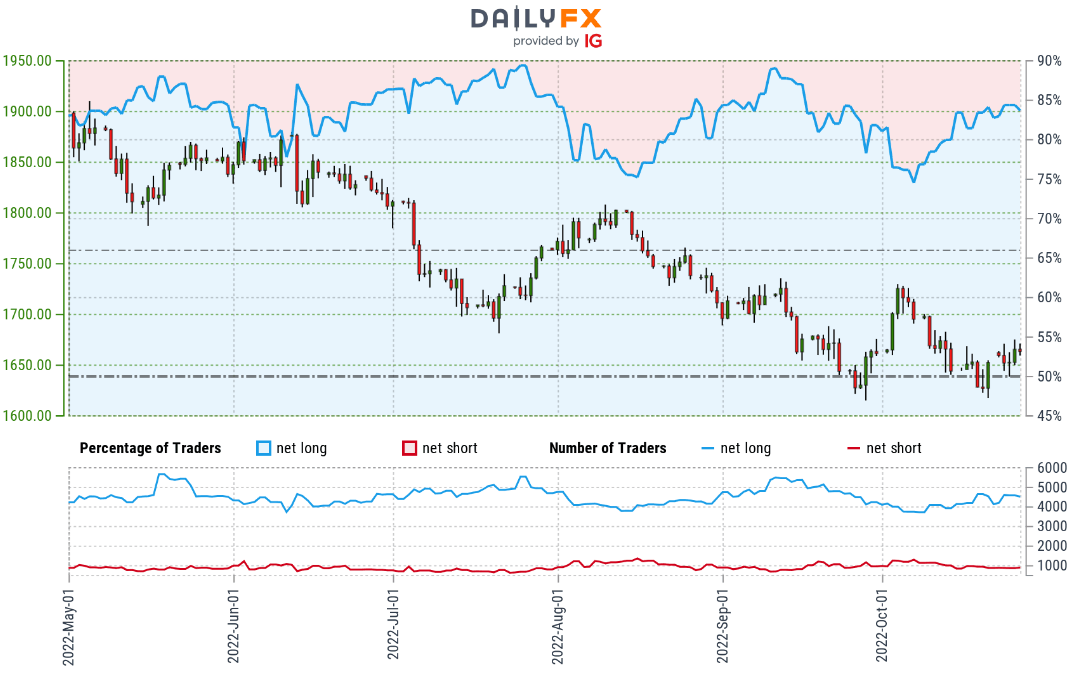
- A summary of IG Client Sentiment shows traders are net-long Gold- the ratio stands at +4.58 (82.09% of traders are long) – typically bearish reading
- Long positions are 1.43% higher than yesterday and 3.00% lower from last week
- Short positions are 8.26% lower than yesterday and 4.77% higher from last week
- We typically take a contrarian view to crowd sentiment, and the fact traders are net-long suggests Gold prices may continue to fall. Traders are more net-long than yesterday but less net-long from last week. The combination of current positioning and recent changes gives us a further mixed Gold trading bias from a sentiment standpoint.
| Change in | Longs | Shorts | OI |
| Daily | 1% | -3% | -1% |
| Weekly | 2% | -8% | -2% |
Active Technical Setups
- Euro Short-term Technical Outlook: EUR/USD Pops Parity- ECB on Tap
- Crude Oil Short-term Technical Outlook: WTI Breakout Imminent
- GBP/USD, USD/CAD & S&P 500 Technical Trade Setups
- British Pound Short-term Technical Outlook: GBP/USD Bristles for Break
- Canadian Dollar Short-term Outlook: USD/CAD Rally Rams into Resistance
- S&P 500 Short-term Technical Outlook: SPX500 Recovery Levels
- Written by Michael Boutros, Technical Strategist with DailyFX
Follow Michael on Twitter @MBForex


