


British Pound Technical Price Outlook: GBP/USD Short-term Trade Levels
- Sterling technical trade level update – Daily & Intraday Charts
- GBP/USD sets weekly / monthly range below key pivot zone- risk for test of yearly downtrend resistance
- Weekly resistance 1.1414/80 (key), 1.1630/50, 1.1843 – Support 1.1120/60, 1.0923, 1.0679
The British Pound rally against the US Dollar has been capped by a critical pivot zone for the last few weeks with the monthly range taking shape just below. The outlook for the recovery off record lows hangs in the balance. These are the updated targets and invalidation levels that matter on the GBP/USD technical charts. Review my latest Strategy Webinar for an in-depth breakdown of this Sterling setup and more.
British Pound Price Chart - GBP/USD Daily
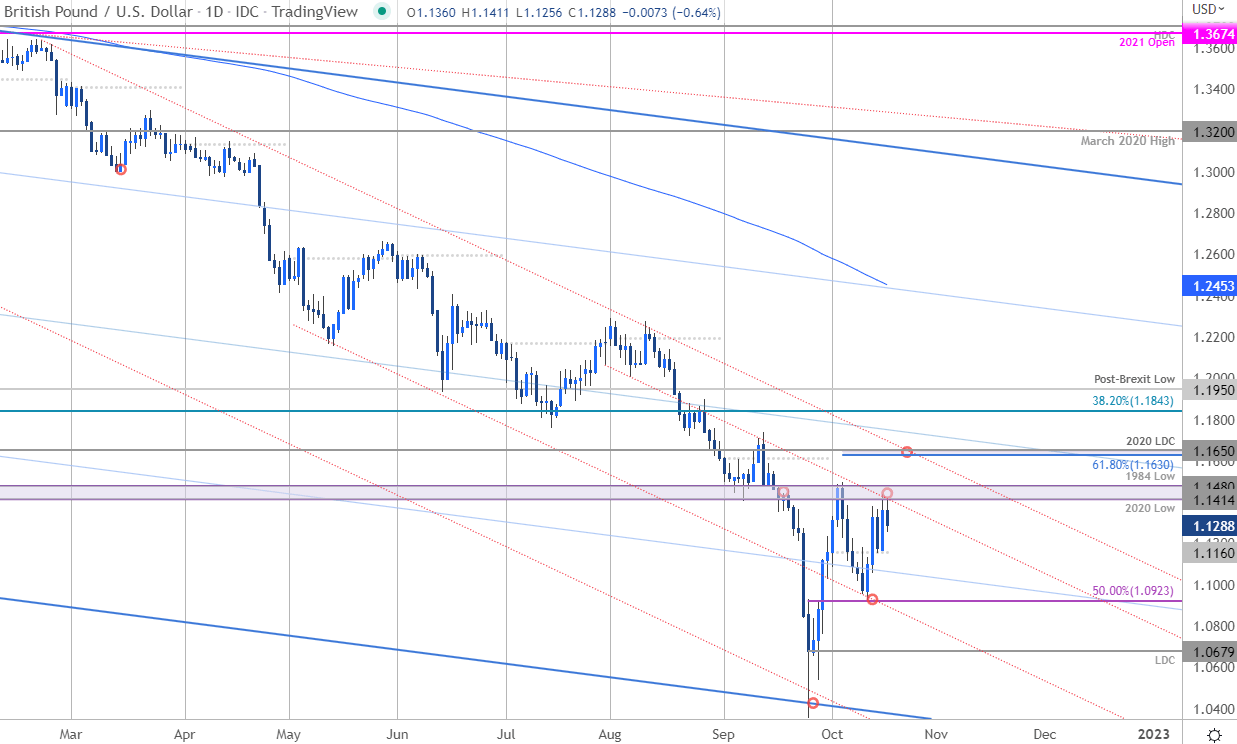
Chart Prepared by Michael Boutros, Technical Strategist; GBP/USD on Tradingview
Technical Outlook: The British Pound is trading just below a key resistance pivot I’ve been highlighting for months now at the 2020 / 1984 lows at 1.1414/80. The October opening-range has been carved just below and the focus is on a breakout here for guidance with the broader outlook still weighted to the downside while below 1.1630/50- a region defined by the February trendline (red), the 61.8% extension of the September advance and the 2020 low-day close.
British Pound Price Chart - GBP/USD 240min
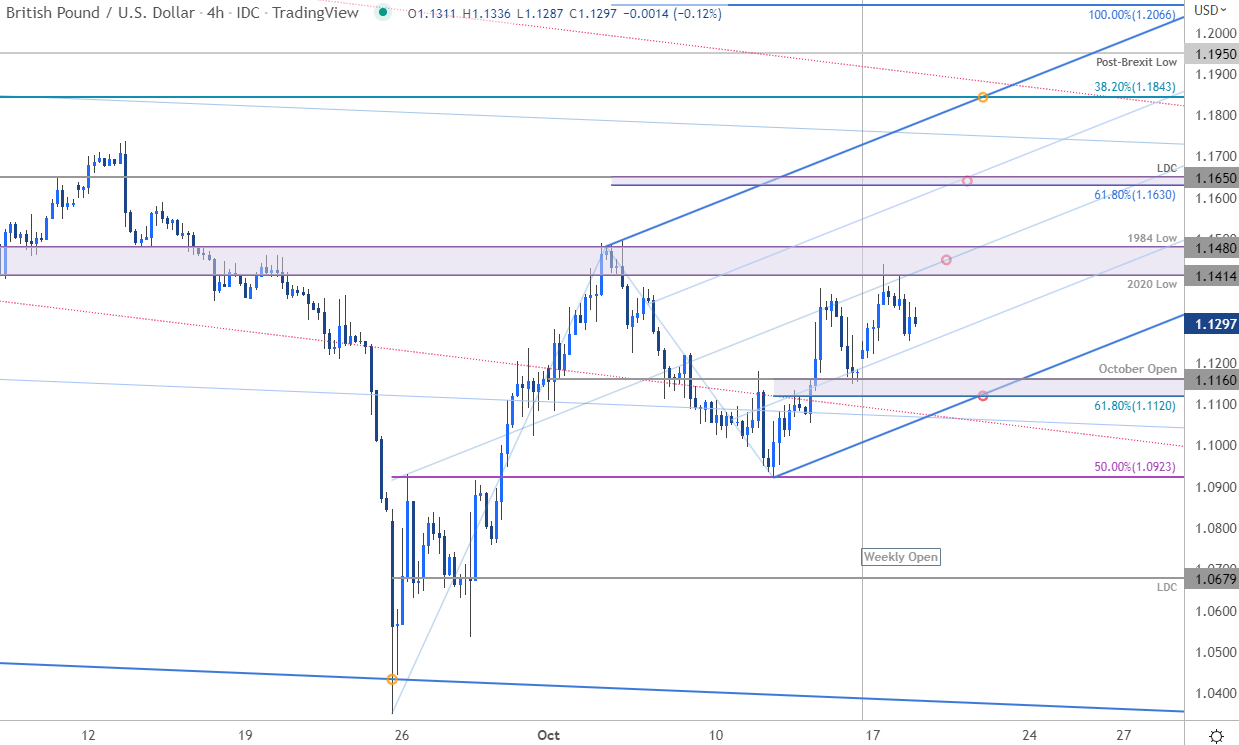
Chart Prepared by Michael Boutros, Technical Strategist; GBP/USD on Tradingview
Notes: A closer look at Sterling price action show GBP/USD trading within the confines of a proposed ascending pitchfork formation extending off the yearly low with the median-line further highlighting resistance at 1.1411/80- Looking for possible price inflection up here. Initial support rests with the 61.8% Fibonacci retracement of the monthly range / October open at 1.1120/60 with a break / daily close below 1.0923 ultimately needed to mark resumption of the broader downtrend towards the yearly low-day close at 1.0679.
For a complete breakdown of Michael’s trading strategy, review his Foundations of Technical Analysis series on Building a Trading Strategy
Bottom Line: Sterling has set the weekly & monthly opening-range just below resistance at 1.1414/80- look for the breakout. From a trading standpoint, losses should be limited to 1.1120 IF price is heading higher on this stretch- ultimately a largely recovery may offer more favorable opportunities closer to downtrend resistance with a break / close below the monthly low needed to mark resumption. Review my latest British Pound Weekly Forecast for a closer look at the longer-term GBP/USD technical trade levels.

British Pound Trader Sentiment - GBP/USD Price Chart
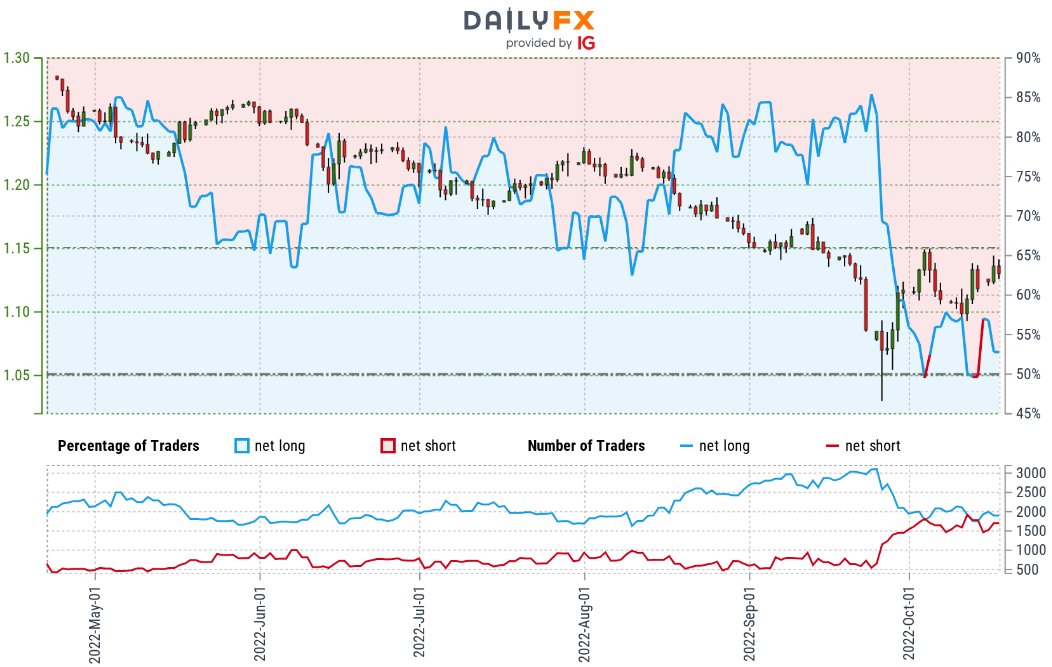
- A summary of IG Client Sentiment shows traders are net-long GBP/USD - the ratio stands at +1.14 (53.28% of traders are long) – typically neutral reading
- Long positions are 10.42% lower than yesterday and 8.70% lower from last week
- Short positions are 4.14% higher than yesterday and 1.12% higher from last week
- We typically take a contrarian view to crowd sentiment, and the fact traders are net-long suggests GBP/USD prices may continue to fall. Yet traders are less net-long than yesterday and compared with last week. From a sentiment standpoint, the recent changes in positioning warn that the current GBP/USD price trend may soon reverse higher despite the fact traders remain net-long.
| Change in | Longs | Shorts | OI |
| Daily | 3% | -7% | -3% |
| Weekly | 4% | -10% | -5% |
UK / US Economic Calendar
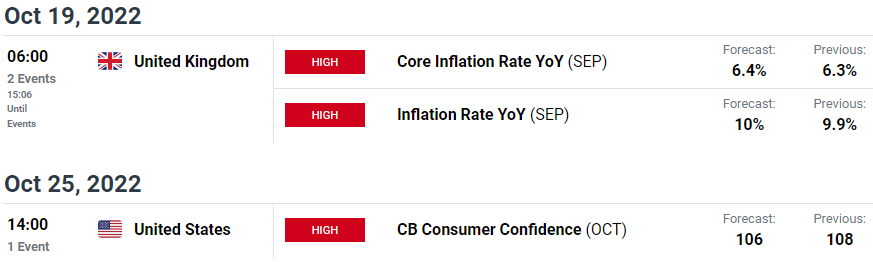
Economic Calendar - latest economic developments and upcoming event risk.
Active Technical Setups
- Canadian Dollar Short-term Outlook: USD/CAD Rally Rams into Resistance
- S&P 500 Short-term Technical Outlook: SPX500 Recovery Levels
- Australian Dollar Short-term Outlook: AUD/USD Breakdown Levels
- Gold Price Short-term Outlook: Gold Threatens Breakout of 2022 Downtrend
- Euro Short-term Technical Outlook: EUR/USD Powers Towards Parity
Foundational Trading Knowledge
Forex for Beginners
New to Forex Trading? Get started with this Beginners Guide
--- Written by Michael Boutros, Technical Strategist with DailyFX
Follow Michael on Twitter @MBForex


