


Australian Dollar Technical Price Outlook: AUD/USD Short-term Trade Levels
- Australian Dollar updated technical trade levels – Daily & Intraday Charts
- AUD/USD plunges towards yearly downtrend support- risk for price inflection
- Aussie resistance 6401, 6547, 6660/70 (key)- Support 6249, 6200 (key), 5979-6041
The Australian Dollar has plunged a staggering 18% off the yearly (April) highs against the US Dollar with AUD/USD now approaching the lower bounds of the 2022 yearly downtrend. While the broader threat remains weighted to the downside, the immediate decline may be vulnerable in the days ahead. These are the updated targets and invalidation levels that matter on the AUD/USD short-term technical charts. Review my latest Weekly Strategy Webinar for an in-depth breakdown of this Aussie technical setup and more.
Australian Dollar Price Chart – AUD/USD Daily
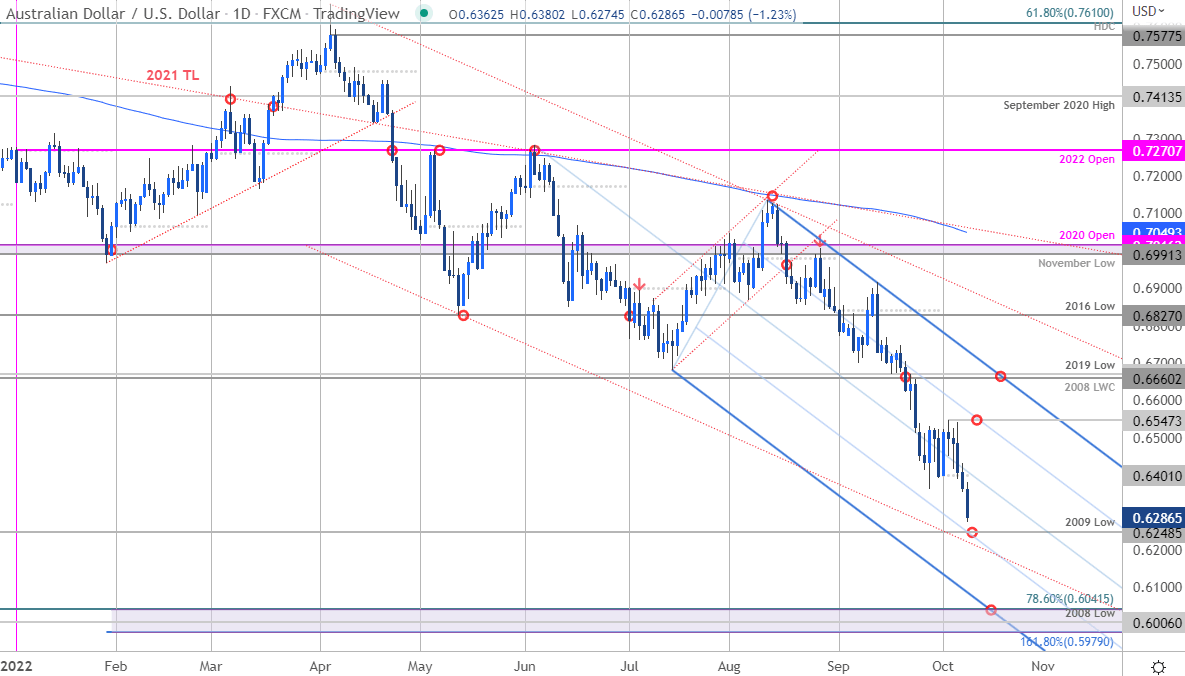
Chart Prepared by Michael Boutros, Technical Strategist; AUD/USD on Tradingview
Technical Outlook: The Australian dollar has been in free fall for nearly two-months with AUD/USD down more than 12% from the August highs. The decline is has been trading within the confines of a descending channel formation extending off the yearly high (red) with an embedded pitchfork (blue) giving guidance to the most recent decline. The sell-off is attempting a fifth consecutive day with Aussie now approaching confluence technical support around the 2009 low at 6248- looking for possible price inflection into this threshold.
Australian Dollar Price Chart – AUD/USD 240min
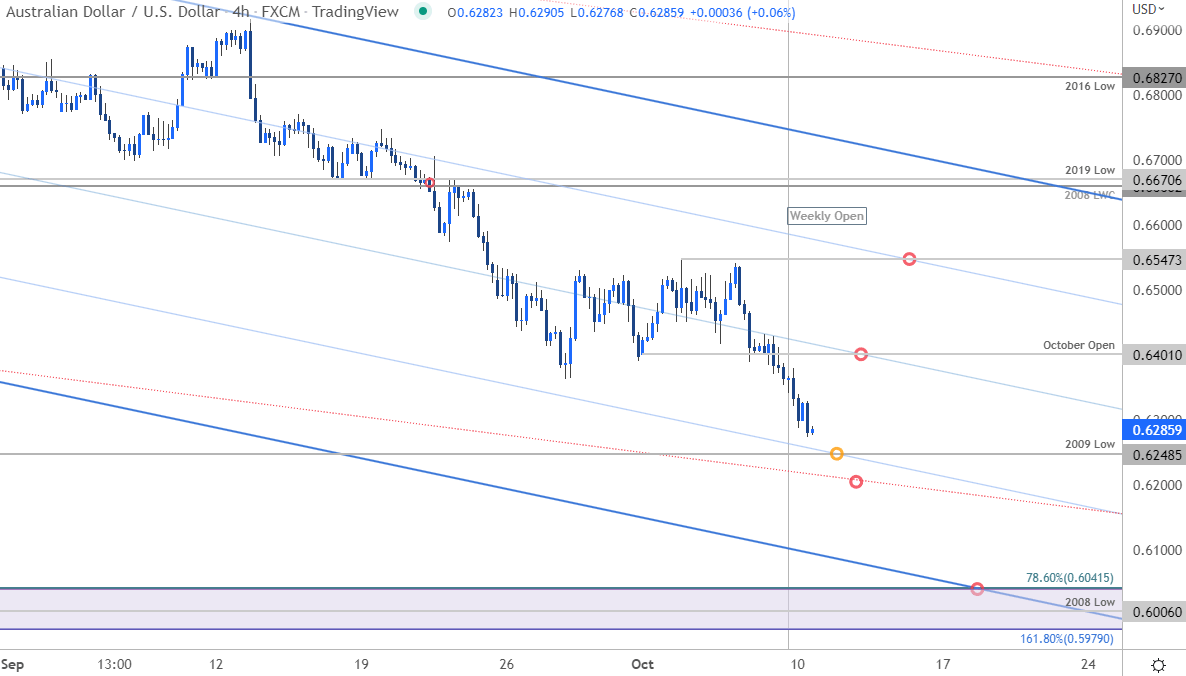
Notes: A closer look at Aussie price action shows AUD/USD approaching initial support here at 6248 with yearly channel support just lower around the 62-handle. A break / daily-close below this threshold would be needed to keep the immediate short-bias viable with such a scenario exposing the next key support zone at 5979-6041- a region defined by the 1.618% extension of the 2021 decline, the 2008 low and the 78.6% Fibonacci retracement of the 2020 rally. Monthly open resistance eyed at 6401 with backed by the objective October opening-range highs at 6547. Broader bearish invalidation now lowered to the 2008 low-week close / 2019 low at 6660/70.

Bottom line: The Australian Dollar is approaching confluence support at multi-year lows and while the broader outlook remains weighted to the downside, the immediate decline may be vulnerable into this threshold. From a trading standpoint, look to reduce portions of short-exposure / lower protective stops on a test of 6200- rallies should be limited by the monthly range highs IF price is heading lower on this stretch. Stay nimble into the weekly close with updated US inflation data on Friday (CPI) likely to fuel some volatility here. Review my latest Australian Dollar Weekly Price Outlook for a closer look at the longer-term AUD/USD technical trade levels.
For a complete breakdown of Michael’s trading strategy, review his Foundations of Technical Analysis series on Building a Trading Strategy
Australian Dollar Trader Sentiment – AUD/USD Price Chart
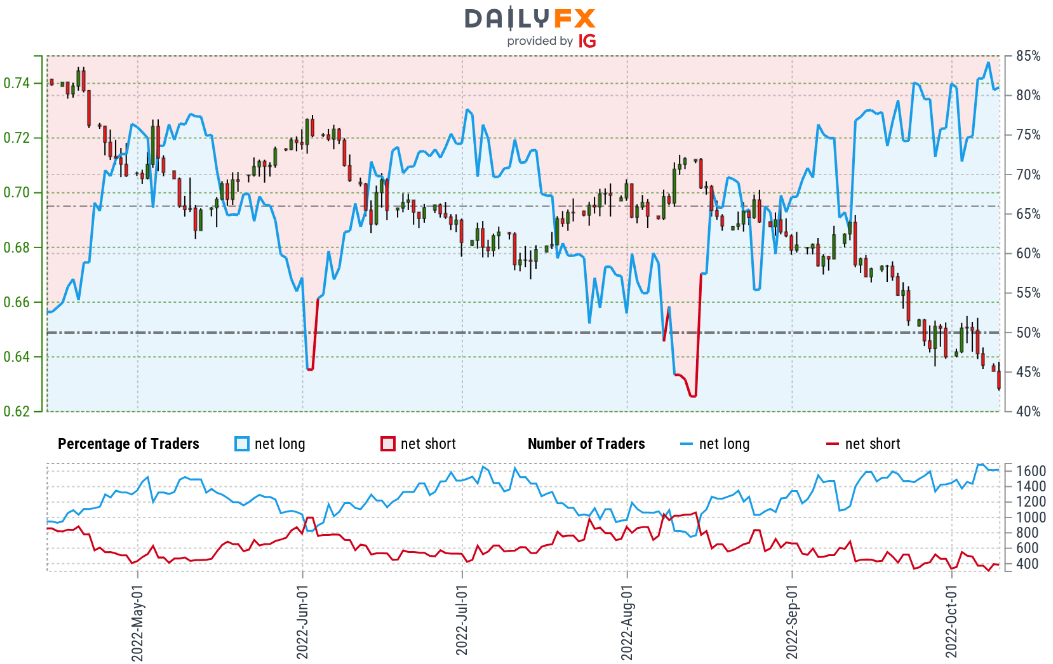
- A summary of IG Client Sentiment shows traders are net-long AUD/USD - the ratio stands at +3.26 (76.52% of traders are long) – typically bearish reading
- Long positions are 3.64% higher than yesterday and 15.60% higher from last week
- Short positions are 26.47% higher than yesterday and 17.81% higher from last week
- We typically take a contrarian view to crowd sentiment, and the fact traders are net-long suggests AUD/USD prices may continue to fall. Yet traders are less net-long than yesterday and compared with last week. From a sentiment standpoint, the recent changes in positioning warn that the current AUD/USD price trend may soon reverse higher despite the fact traders remain net-long.
| Change in | Longs | Shorts | OI |
| Daily | 2% | 3% | 2% |
| Weekly | 29% | -46% | 0% |
Economic Calendar
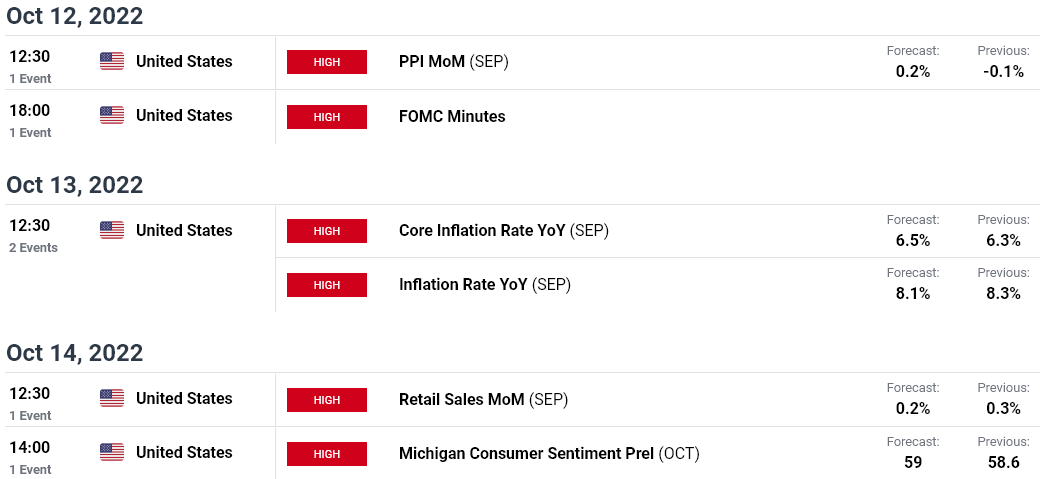
Economic Calendar - latest economic developments and upcoming event risk.
Active Technical Setups
- Gold Price Short-term Outlook: Gold Threatens Breakout of 2022 Downtrend
- Euro Short-term Technical Outlook: EUR/USD Powers Towards Parity
- Japanese Yen Short-term Technical Outlook: USD/JPY Rally Vulnerable
--- Written by Michael Boutros, Technical Strategist with DailyFX
Follow Michael on Twitter @MBForex


