


British Pound Technical Price Outlook: GBP/USD Weekly Trade Levels
- Sterling technical trade level update – Weekly Chart
- GBP/USD sets range below key pivot zone- risk for test of yearly downtrend resistance
- Weekly resistance 1.1414/80 (key), 1.1650, 1.1843-1.1950 – Support 1.0923, 1.0790-1.0840, 1.0520

The British Pound rallied more than 0.6% against the US Dollar this week with GBP/USD carving the October opening-range just below a key resistance pivot. The threat of a larger recovery within the broader yearly downtrend remains and the focus is on a breakout of the monthly range for guidance. These are the updated targets and invalidation levels that matter on the GBP/USD weekly chart heading into October. Review my latest Strategy Webinar for an in-depth breakdown of this Sterling technical setup and more.
British Pound Price Chart - GBP/USD Weekly
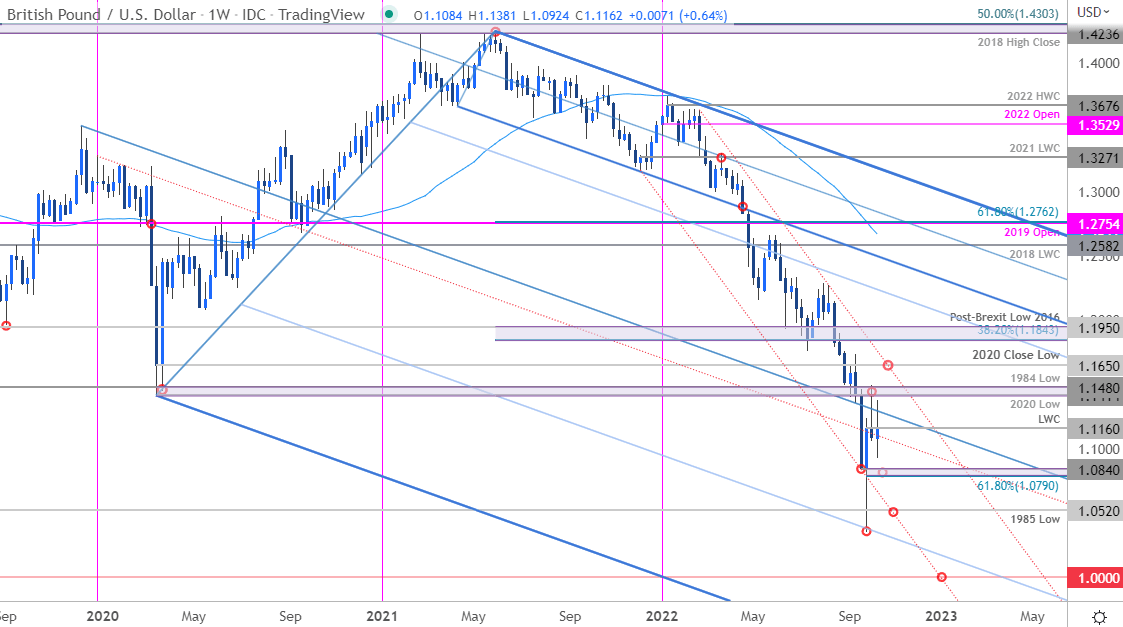
Chart Prepared by Michael Boutros, Technical Strategist; GBP/USD on Tradingview
Notes: In my last British Pound Weekly Technical Forecast I noted that the GBP/USD, “recovery is now approaching the first major test at a key pivot zone- looking for possible price inflection / exhaustion off this mark. From a trading standpoint, risk for some pullback here - losses would need to be limited to 1.0790 to suggest a more significant low was registered last month.” The resistance region in focus was defined by the 2020 / 1984 lows at 1.1414/80 and capped the advance last week with the pullback registering a low the monthly range low at 1.0924 this week- was that the extent of the Sterling pullback? The jury is still out.
The focus now shifts to a breakout of the October opening-range with key support steady at the 61.8% Fibonacci retracement of the September rally / weekly low-close at 1.0790-1.0840- a break / close below this threshold is needed to mark resumption of the broader downtrend towards the 1985 low at 1.0520 and the lower parallels. Broader bearish invalidation now lowered to the 2020 weekly low-close at 1.1650 – a breach above this threshold would denote a breakout of he yearly downtrend and suggest a more significant low was registered last month.
For a complete breakdown of Michael’s trading strategy, review his Foundations of Technical Analysis series on Building a Trading Strategy
Bottom Line: Looking for more chop / sideways price action in the British Pound with the focus on a breakout of the October opening-range (1.0924-1.1480). From a trading standpoint, losses should still be limited to 1.0790 IF price is heading higher for a test of downtrend resistance. I’ll publish an updated Sterling short-term trade outlook once we get further clarity on the near-term GBP/USD technical trade levels.

British Pound Trader Sentiment - GBP/USD Price Chart
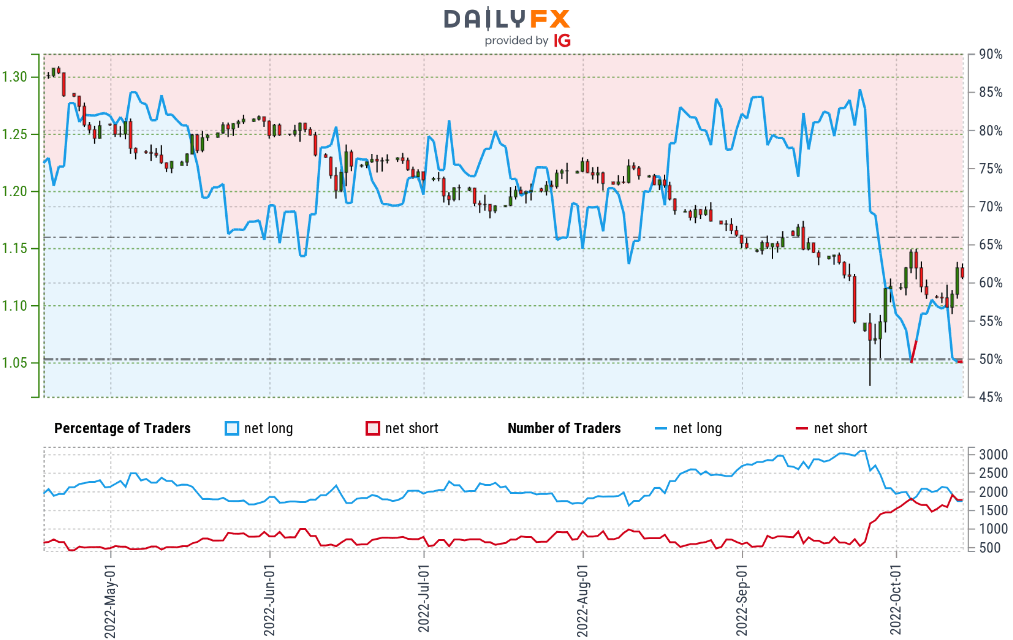
- A summary of IG Client Sentiment shows traders are net-long GBP/USD - the ratio stands at +1.08 (51.89% of traders are long) – typically neutral reading
- Long positions are 5.20% lower than yesterday and 13.19% lower from last week
- Short positions are 11.45% lower than yesterday and 1.36% higher from last week
- We typically take a contrarian view to crowd sentiment, and the fact traders are net-long suggests GBP/USD prices may continue to fall. Traders are more net-long than yesterday but less net-long from last week. The combination of current positioning and recent changes gives us a further mixed GBP/USD trading bias from a sentiment standpoint.

UK / US Economic Calendar
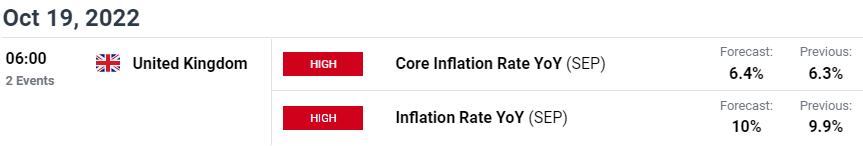
Economic Calendar - latest economic developments and upcoming event risk.
Active Weekly Technical Charts
- Canadian Dollar (USD/CAD)
- Gold (XAU/USD)
- S&P 500, Nasdaq & Dow
- US Dollar Index (DXY)
- Euro (EUR/USD)
- Crude Oil (WTI)
- Australian Dollar (AUD/USD)
- Japanese Yen (USD/JPY)

--- Written by Michael Boutros, Technical Strategist with DailyFX
Follow Michael on Twitter @MBForex


