


Short-term Trade Outlook: Technical Setups on GBP/USD, USD/CAD & S&P 500
- GBP/USD range breakout pending – to determine outlook for correction off record lows
- USD/CAD reversal off uptrend resistance threatens test of uptrend support
- S&P 500 rebounds off key support- recovery levels in focus to offer reset
An update on technical setups we've been tracking in the British Pound, Canadian Dollar and the S&P 500. These are the targets and invalidation levels that matter heading into the close of the week. Review my latest Strategy Webinar for an in-depth breakdown of these technical setups and more.
British Pound Price Chart – GBPS/USD 240min
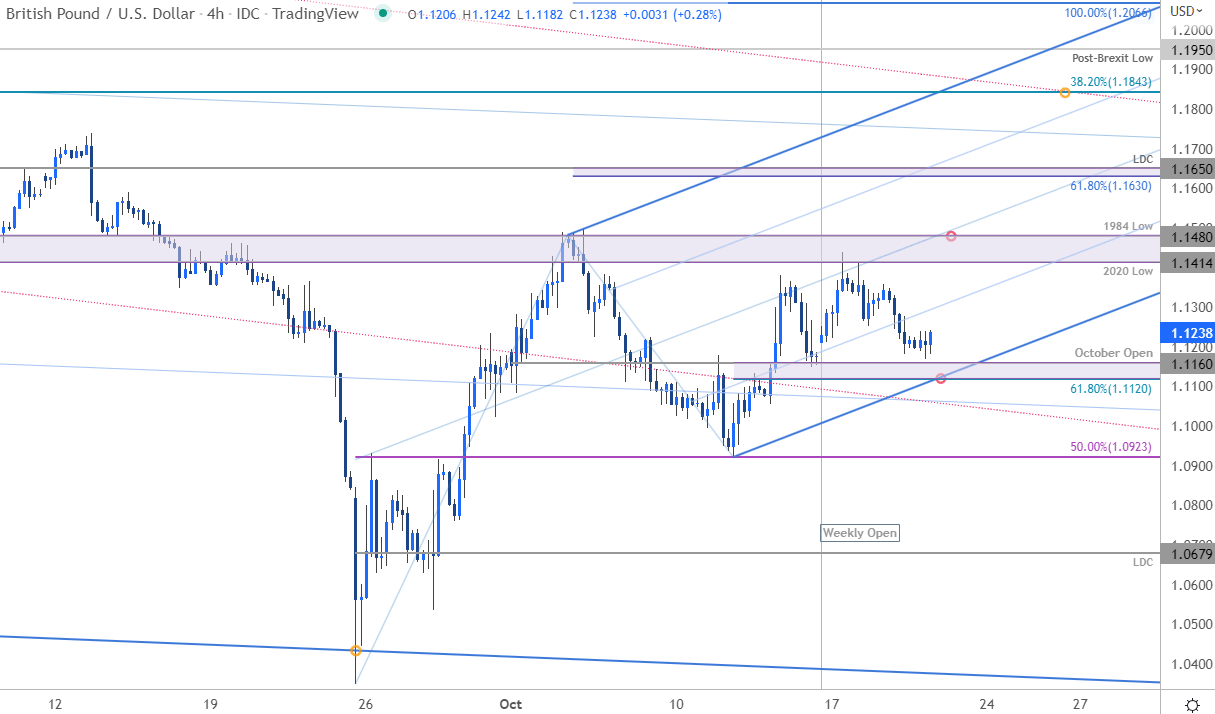
Chart Prepared by Michael Boutros, Technical Strategist; GBP/USD on Tradingview
Notes: In my last British Pound Short-term Outlook I noted that, “Sterling has set the weekly & monthly opening-range just below resistance at 1.1414/80- look for the breakout. From a trading standpoint, losses should be limited to 1.1120 IF price is heading higher on this stretch.” The setup remains unchanged with the weekly range re-enforcing the significance of a breakout of the 1.1120-1.1480 range for guidance in the days ahead. Ultimately, a topside breach may offer more favorable opportunities closer to downtrend resistance with a break / close below the October range-lows needed to mark resumption of the broader downtrend towards 1.0923 and the low-day close at 1.0679.
Bottom line: Looking for a breakout here for guidance with the threat for a larger recovery while within this near-term formation. A topside breach would threaten a larger recovery towards 1.1630/50 and 1.1843- both levels of interest for possible topside exhaustion IF reached. Keep in mind that a downside break of this pitchfork could likely fuel another accelerated sell-off – stay nimble here. Review my latest British Pound Weekly Forecast for a closer look at the longer-term GBP/USD technical trade levels.
British Pound Trader Sentiment - GBP/USD Price Chart
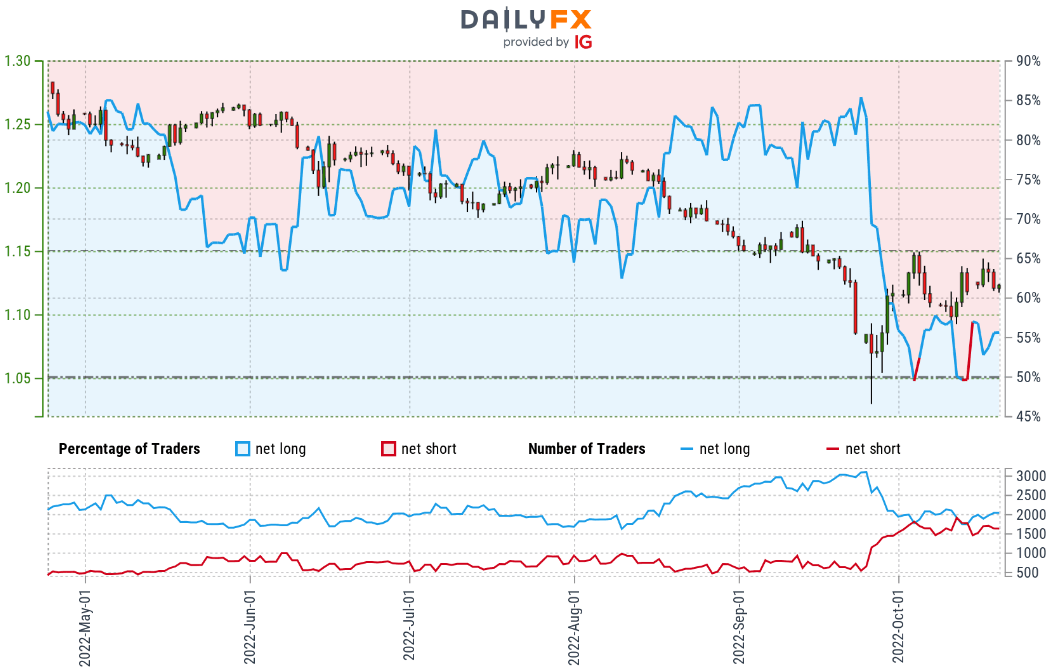
- A summary of IG Client Sentiment shows traders are net-long the British Pound - the ratio stands at +1.22 (54.94% of traders are long) – typically weak bearish reading
- Long positions are 2.10% higher than yesterday and 7.56% higher from last week
- Short positions are 0.12% higher than yesterday and 11.14% lower from last week
- We typically take a contrarian view to crowd sentiment, and the fact traders are net-long suggests GBP/USD prices may continue to fall. Traders are further net-long than yesterday and last week, and the combination of current sentiment and recent changes gives us a stronger GBP/USD-bearish contrarian trading bias from a sentiment standpoint.
| Change in | Longs | Shorts | OI |
| Daily | 3% | -7% | -3% |
| Weekly | 4% | -10% | -5% |
Canadian Dollar Price Chart – USD/CAD 120min
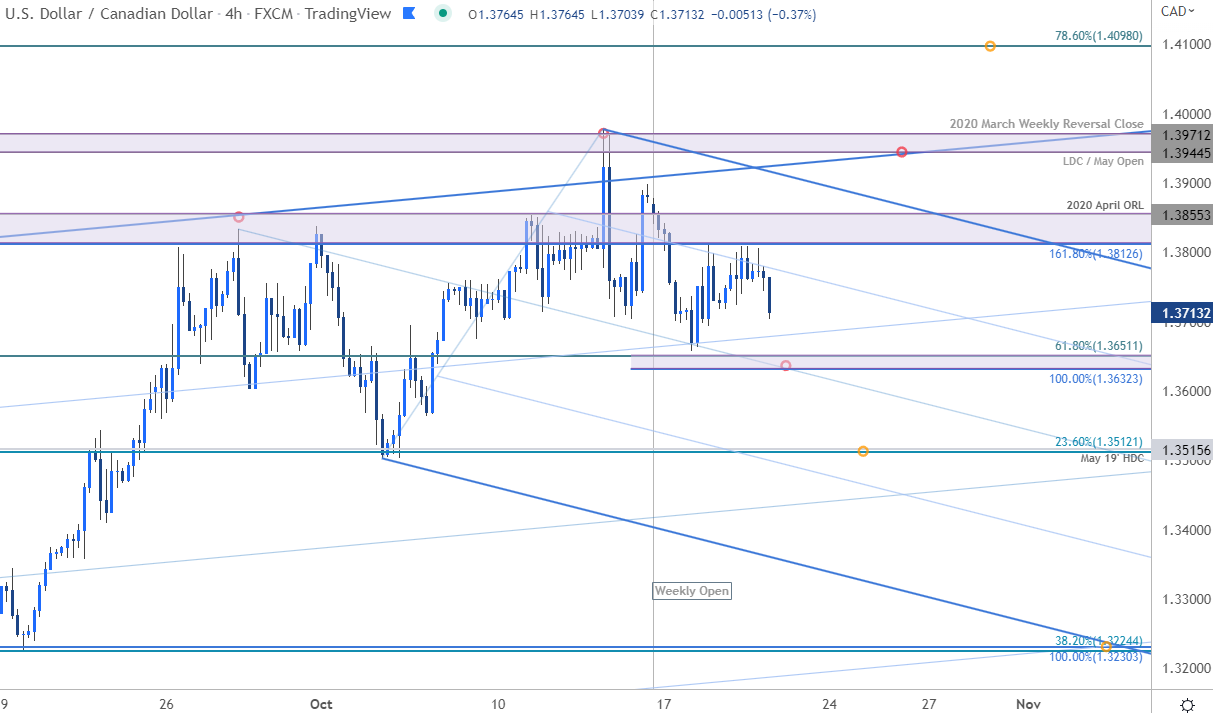
Chart Prepared by Michael Boutros, Technical Strategist; USD/CAD on Tradingview
Notes: Earlier this week, I highlighted a key resistance range in USD/CAD at 1.3812/55- a region defined by the 1.618% extension, the objective October monthly open and the April 2020 low. Price continues to trade within the confines of this newly-identified descending pitchfork formation with key support steady at 1.3632/51. A break below this threshold would threaten a larger correction within the confines of the broader uptrend with such a scenario exposing 1.3502/15- look for a larger reaction there IF reached for guidance. Ultimately, a topside breach / daily close above 1.3944/71 is needed to mark resumption towards subsequent resistance objectives into the 1.41-handle and beyond.
Bottom line: USD/CAD has responded to technical uptrend resistance and the threat remains for a corrective pullback while below 1.3812/55. A larger pullback here may offer more favorable opportunities closer to trend support with a topside breach needed to fuel the next leg higher in the US Dollar. Review my latest USD/CAD Weekly Price Outlook for a closer look at the longer-term Canadian Dollar technical trade levels.
S&P 500 Price Chart – SPX500 Daily
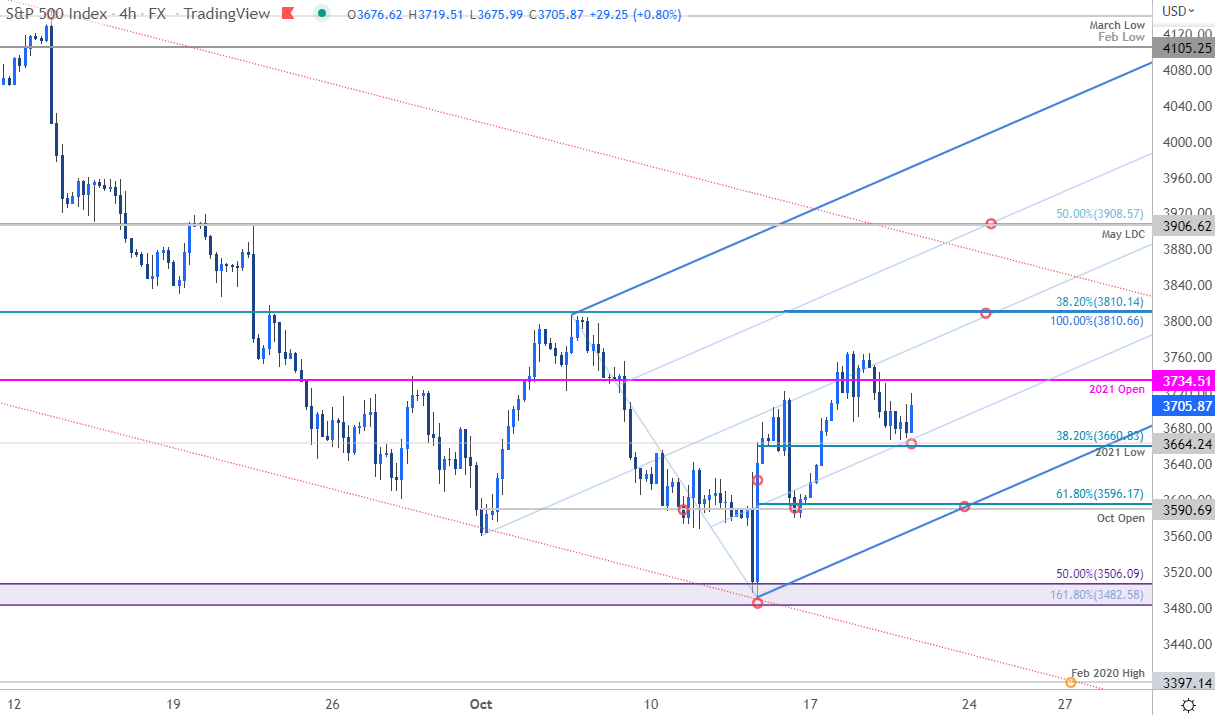
Chart Prepared by Michael Boutros, Technical Strategist; SPX500 on Tradingview
Notes: In last week’s S&P 500 Short-term Technical Outlook I highlighted the threat for a larger recovery in the index after rebounding off key technical support at 3482-3501- a region defined by the 50% retracement of the 2020 advance and the 1.618% Fibonacci extension. Price rebounded more than 7.8% off the lows with the advance faltering just above targeted resistance at the objective 2021 yearly open at 3734. Initial support now rests at 3660/64 with near-term bullish invalidation steady at 3590/96- a break / close below this threshold is needed to mark resumption of the broader downtrend towards 3482-3506 and the February 2020 high at 3397. Topside resistance eyed at 3810 and 3906/08- both represent areas of interest for possible topside exhaustion /price infection IF reached.
Bottom line: The S&P 500 rebound is maturing and while the focus remains constructive within this ascending formation, I’m on the lookout for possible exhaustion closer to downtrend resistance IF reached. Ultimately, a break below 3590 needed to fuel the next leg lower in the index. Review my last S&P 500 Weekly Technical Forecast for a closer look at the longer-term SPX 500 technical trade levels.

For a complete breakdown of Michael’s trading strategy, review his Foundations of Technical Analysis series on Building a Trading Strategy
-Written by Michael Boutros, Technical Strategist with DailyFX
Follow Michael on Twitter @MBForex


