


Crude Oil Technical Forecast: WTI Short-term Trade Levels
- Crude Oil updated technical trade levels – Daily & Intraday Charts
- WTI holding well-defined range below key pivot- breakout pending
- New to Oil Trading? Get started with this Free How to Trade Oil- Beginners Guide
Crude oil prices are poised for a breakout with WTI holding a tight range just below a key pivot zone. I’m on the lookout for a possible breakout in the days ahead with oil still threatening a larger recovery while above the 82-handle. These are the updated targets and invalidation levels that matter on the oil price technical charts. Review my latest Strategy Webinar for an in-depth breakdown of this crude oil price technical setup and more.
Crude Oil Price Chart – WTI Daily
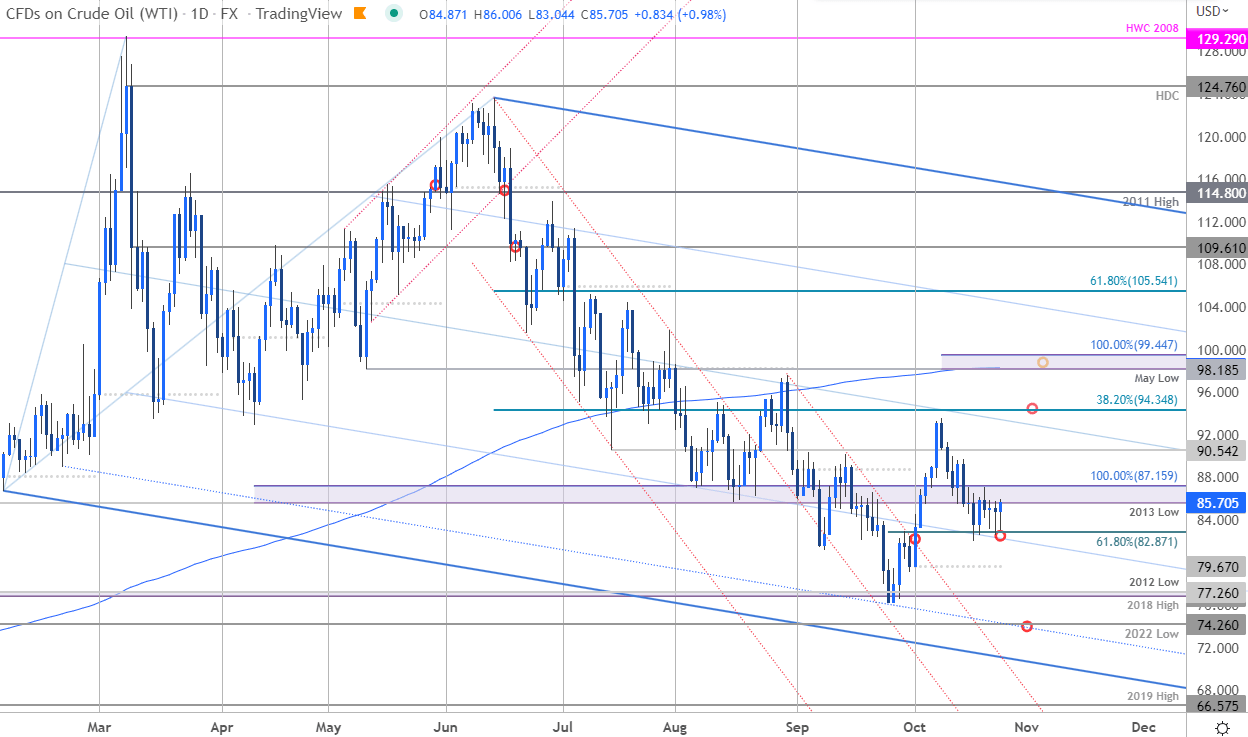
Chart Prepared by Michael Boutros, Technical Strategist; Crude Oil (WTI) on Tradingview
Technical Outlook: Crude oil prices rebounded off downtrend support last month with the recovery pulling back into Fibonacci support last week at the 61.8% retracement of the late-September rally around 82.87. WTI has been trading in a range just below a technical pivot zone for the past seven-days at 85.61-87.15 – a region defined by the 2013 low and the 100% extension of the yearly decline. I’m on the lookout for a breakout of this range for guidance with the risk of a larger recovery remaining while above last week’s lows.
Crude Oil Price Chart - WTI 240min
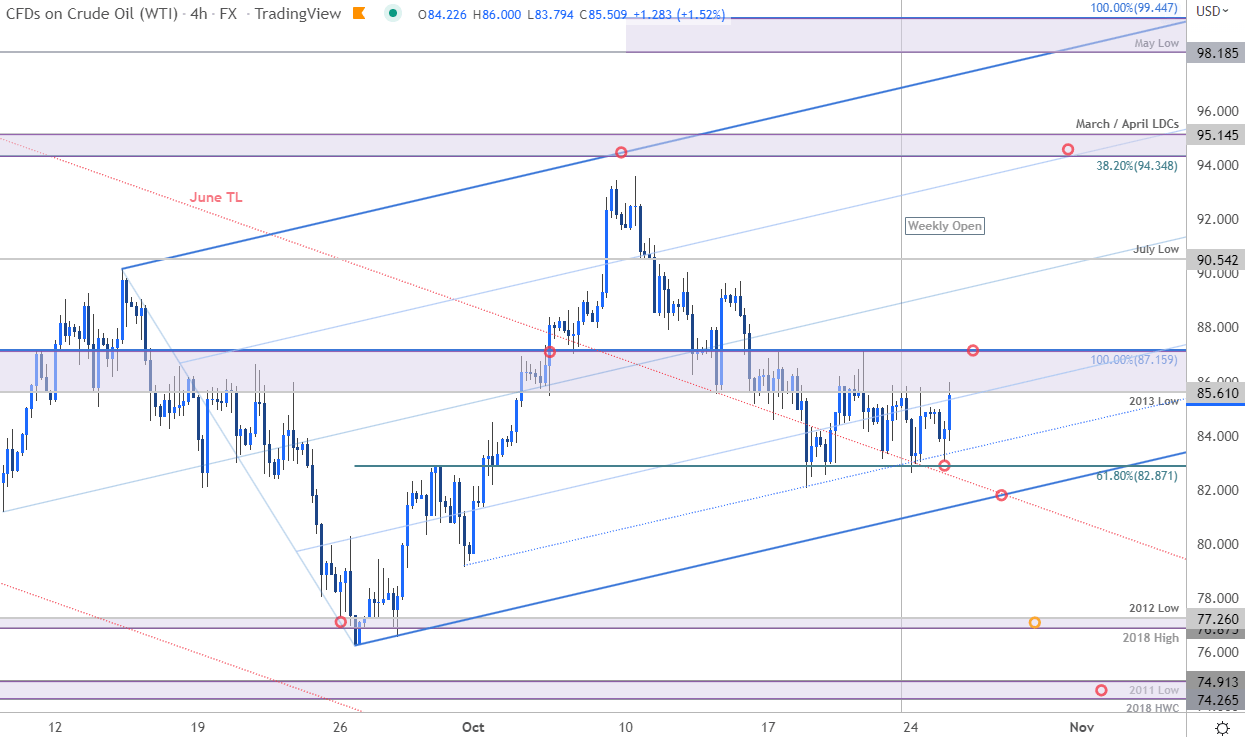
Notes: A closer look at oil price action shows WTI continuing to trade within the confines of a near-term ascending pitchfork formation I presented in the Weekly Strategy Webinar more than two weeks ago. Price has been trading within the 82.87-87.15 range for over a week now and the immediate focus is on a breakout over the next few days.
The threat for a larger rebound remains while above the lower parallel (~82) with a topside breach / daily close above needed to fuel the next leg higher towards the July low a 90.54 and the 38.2% retracement of the June decline / March & April low-day closes at 94.35-95.15. Key resistance / bearish invalidation is eyed at the May low / 100% extension off he September rally at 98.18-99.45- look for larger reaction in price there IF reached. A break below this formation would threaten resumption of the broader downtrend with such a scenario exposing subsequent support objectives at the 2018 high / 2012 low at 76.87-77.26 and the 2018 high-week close / 2011 low at 74.26/91.

Bottom line: Oil prices are ranging just above medium-term uptrend support and just below a key pivot zone – the breakout should offer some guidance here. From a trading standpoint, losses should be limited by the 82-handle IF price is indeed heading higher with a breach / close above 87.15 needed to fuel the next leg towards the upper parallels. Keep in mind that ultimately, a break below the monthly open at 79.67 would threaten another accelerated decline in WTI- tread lightly here. I’ll publish an updated Crude Oil Weekly Price Forecast once we get further clarity on the long-term WTI technical trade levels.
For a complete breakdown of Michael’s trading strategy, review his Foundations of Technical Analysis series on Building a Trading Strategy
Crude Oil Trader Sentiment – WTI Price Chart
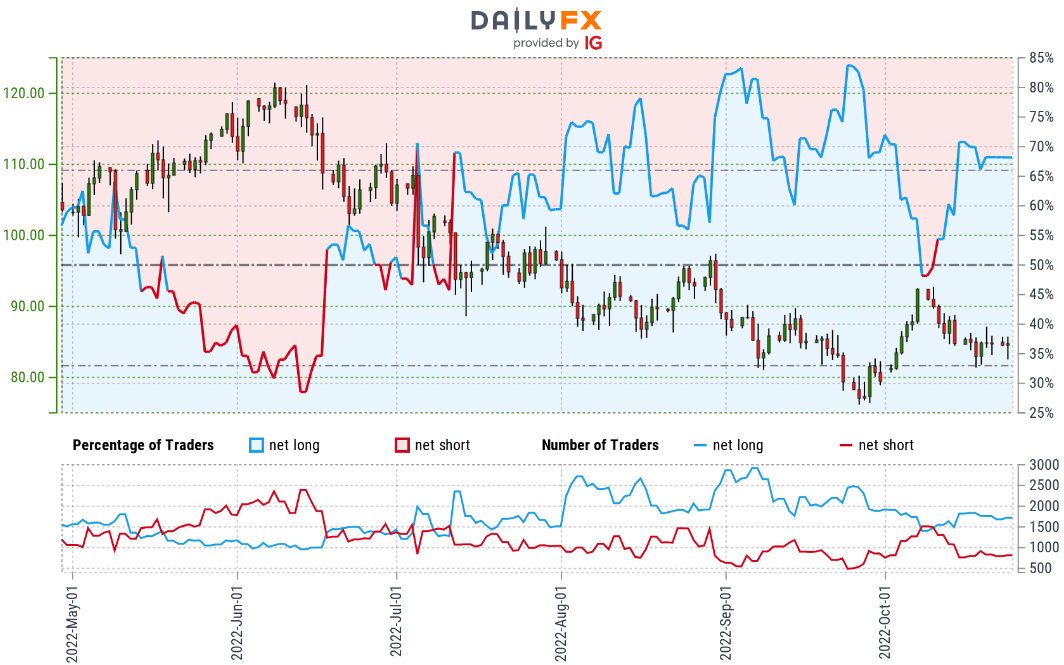
- A summary of IG Client Sentiment shows traders are net-long crude oil - the ratio stands at +2.28 (69.55% of traders are long) – typically bearish reading
- Long positions are 1.85% lower than yesterday and 4.28% lower from last week
- Short positions are 2.75% lower than yesterday and 2.17% lower from last week
- We typically take a contrarian view to crowd sentiment, and the fact traders are net-long suggests Oil - US Crude prices may continue to fall. Traders are more net-long than yesterday but less net-long from last week. From a sentiment standpoint, the combination of current positioning and recent changes gives us a further mixed Crude Oil trading bias.
| Change in | Longs | Shorts | OI |
| Daily | 3% | -7% | 1% |
| Weekly | 31% | -38% | 7% |
Active Technical Setups
- Gold Price Short-term Outlook: Gold on the Precipice- XAU Support
- GBP/USD, USD/CAD & S&P 500 Technical Trade Setups
- British Pound Short-term Technical Outlook: GBP/USD Bristles for Break
- Canadian Dollar Short-term Outlook: USD/CAD Rally Rams into Resistance
- S&P 500 Short-term Technical Outlook: SPX500 Recovery Levels
- Australian Dollar Short-term Outlook: AUD/USD Breakdown Levels
Trading Strategies and Risk Management
Becoming a Better Trader
Learn how to Trade with Confidence - Free Trading Guide
--- Written by Michael Boutros, Technical Strategist with DailyFX
Follow Michael on Twitter @MBForex


