


US Dollar Technical Price Outlook: DXY Weekly Trade Levels
- US Dollar technical trade level update – Weekly Chart
- USD Fed rally reverses post-NFPs – threat for correction remains
- DXY support 109.64, 108.09/74, 104.88-105– Resistance 112.17, 114.78-115.29, 116.20s
The US Dollar Index snapped a two-week losing streak with the DXY up nearly 0.5% heading into the weekly close. The dollar relinquished all of the post-FOMC gains on Friday despite a strong US non-farm payroll (NFP) release and the reversal threatens another test of the lows in the days ahead. These are the updated technical targets and invalidation levels that matter on the US Dollar Index weekly price chart. Review my latest Strategy Webinar for an in-depth breakdown of this DXY technical setup and more.
US Dollar Index Price Chart – DXY Weekly
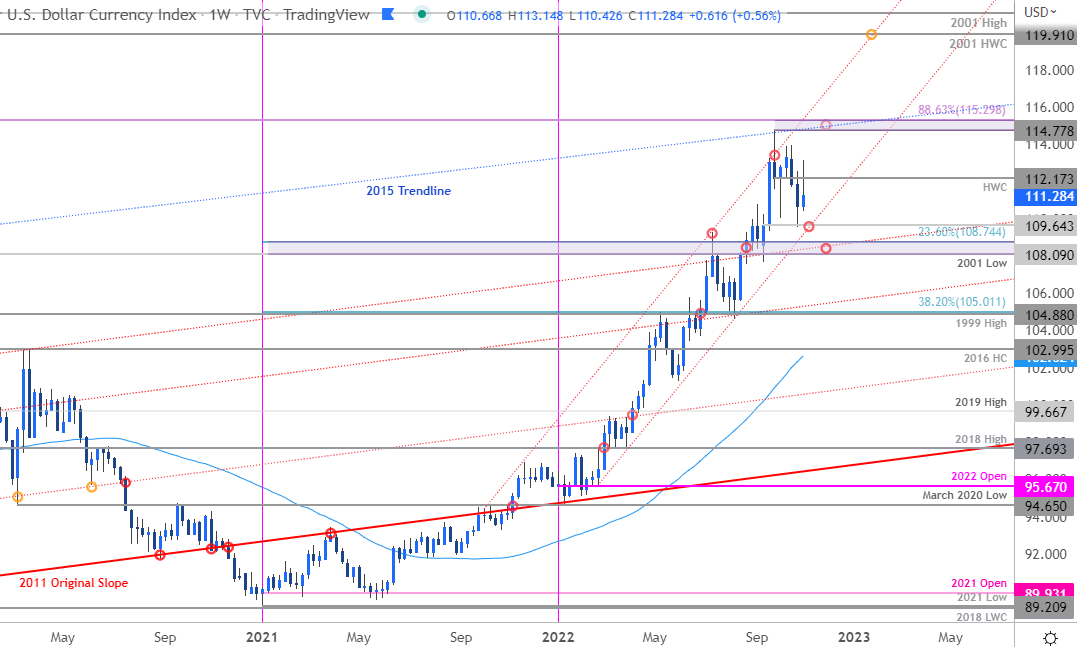
Chart Prepared by Michael Boutros, Technical Strategist; US Dollar Index on Tradingview
Notes: In my last US Dollar Weekly Price Outlook I noted that, “While the broader US Dollar outlook remains constructive, the immediate advance may be vulnerable here after responding to uptrend resistance.” The focus was on support objectives at “the yearly high-week close at 112.17 backed by the September low-week reversal-close at 109.64.” The index registered a low the following week at 109.53 before rebounding with the rally failing to close back above 112.17 this week. Does the correction lower have further to go?
Weekly support rests at 109.64 with medium-term bullish invalidation steady at the 2001 low / 23.6% retracement of the 2021 rally at 108.09/74- once again its worth noting that weakness beyond this threshold would suggest a larger reversal is underway / more significant high was registered last month. Key resistance remains unchanged at yearly high / 88.6% Fibonacci retracement of the 2001 decline at 114.78-115.29 backed closely by channel resistance (currently near ~116.20s) with subsequent objectives eyed at and the 2001 high-week close at 119.91 and that same yearly swing high at 121.02.
For a complete breakdown of Michael’s trading strategy, review his Foundations of Technical Analysis series on Building a Trading Strategy
Bottom line: While the broader US Dollar outlook is still weighted to the topside, the index remains vulnerable for a deeper correction while below 112.17. From a trading standpoint, losses should be limited to 108.09 for the yearly uptrend to remain viable with a breach / close above 115.30 needed to fuel the next leg higher in price. Stay nimble heading into key inflation data on tap next week with the data likely to produce some volatility here. I’ll publish an updated US Dollar Short-term Price Outlook once we get further clarity on the near-term DXY technical trade levels.

US Economic Calendar
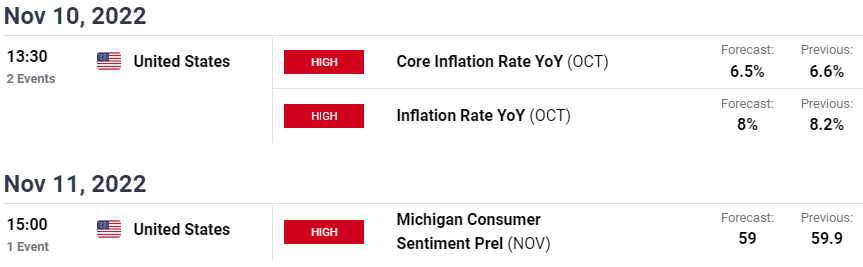
Economic Calendar - latest economic developments and upcoming event risk.
Active Weekly Technical Charts
- British Pound (GBP/USD)
- Crude Oil (WTI)
- Canadian Dollar (USD/CAD)
- Japanese Yen (USD/JPY)
- S&P 500, Nasdaq & Dow
- Australian Dollar
- Euro (EUR/USD)
- Japanese Yen (USD/JPY)
- Gold (XAU/USD)
-- Written by Michael Boutros, Technical Strategist with DailyFX
Follow Michael on Twitter @MBForex


