


Weekly Technical Trade Levels on USD Majors, Commodities & Stocks
- Technical setups we’re tracking into the weekly open
- Key levels for the US Dollar Majors, Gold, S&P 500, Crude Oil and more!
- Major Event Risk: FOMC interest rate decision & NFPs on tap into November open
In this webinar we take an in-depth look at the technical trade levels for US Dollar (DXY), Euro (EUR/USD), British Pound (GBP/USD), Canadian Dollar (USD/CAD), Australian Dollar (AUD/USD), Japanese Yen (USD/JPY), Gold (XAU/USD), S&P 500 (SPX500), Nasdaq (NDX) and the Dow Jones Industrial Average (DJI). These are the levels that matter this heading into the November open with the FOMC interest rate decision & NFPs on tap this week.
You can always find the latest Weekly Strategy Webinar on my YouTube playlist.
Euro Price Chart – EUR/USD 240min
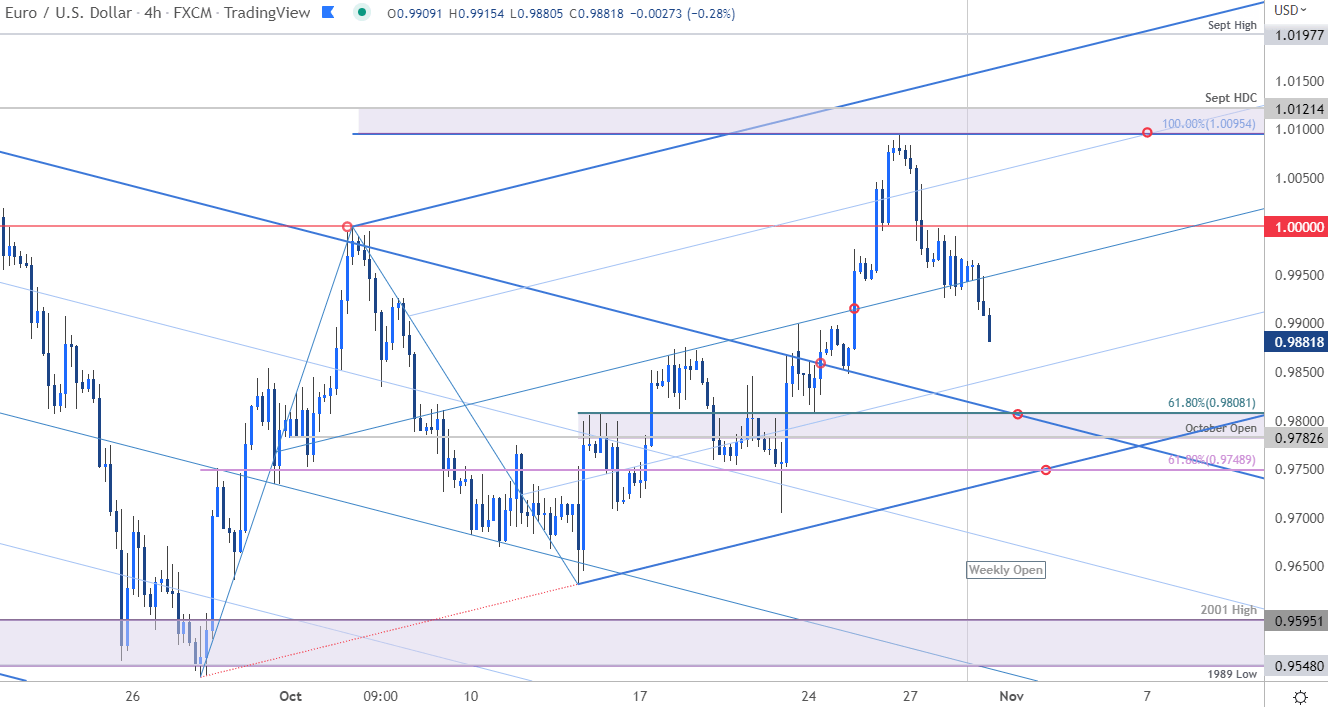
Chart Prepared by Michael Boutros, Technical Strategist; EUR/USD on Tradingview
I’ve been tracking this short-term setup EUR/USD for over a week now and the focus pullback off key resistance at 1.0095-1.0121. Initial support rests with the monthly open / 61.8% retracement of the October range at 9782-9808 backed by the 61.8% retracement of the entire September rally at 9748- losses should be limited to this level IF Euro is indeed heading higher on this stretch.
Canadian Dollar Price Chart – USD/CAD 240min
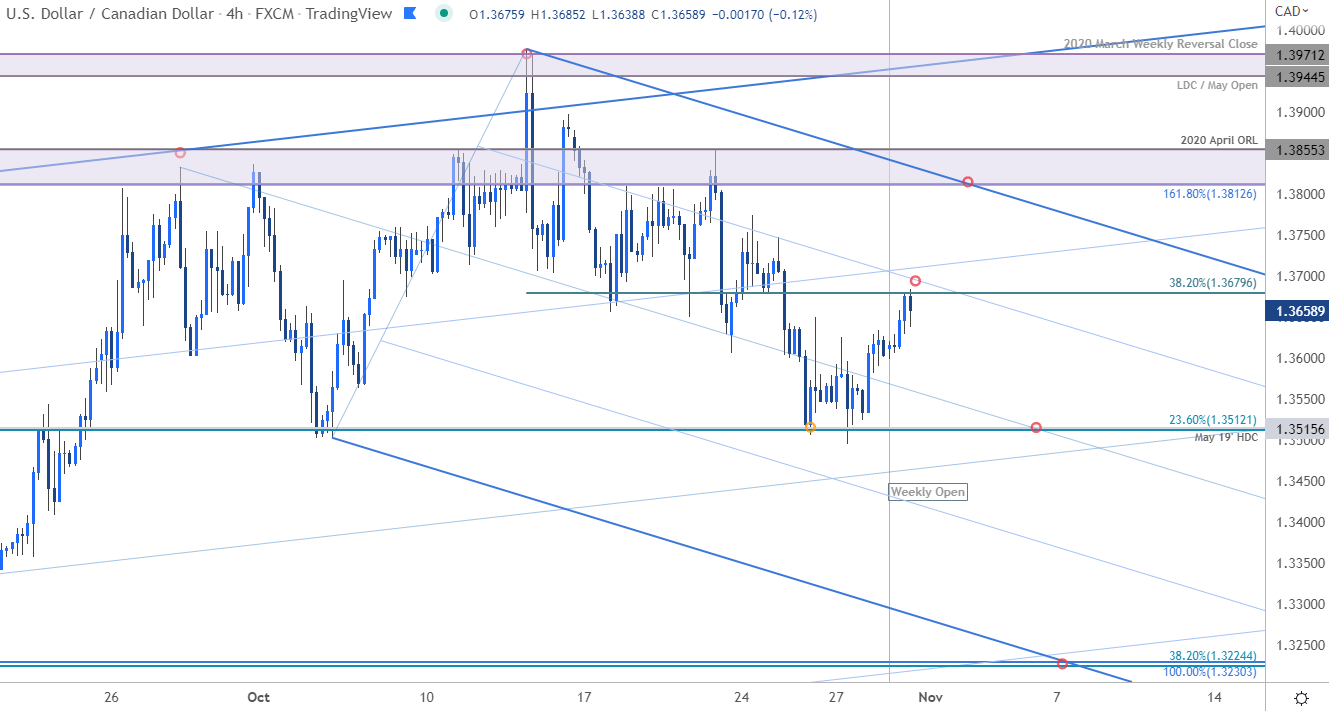
Chart Prepared by Michael Boutros, Technical Strategist; USD/CAD on Tradingview
Price action has been rather clean within the confines of this descending formation – the focus is on this recovery. Initial resistance here into the 75% parallel – a breach would threaten another test of key resistance / bearish invalidation at 1.3812/55. Be on the lookout for an exhaustion high ahead of this zone IF price is heading lower on this stretch with a break / close below key support at 1.3512/15 needed to fuel the next leg. Keep in mind USD/CAD is heading into a BIG week with the Fed, NFPs and Canada employment figures on tap into the start of a new month- stay nimble here.
S&P 500 Price Chart – SPX500 240min Chart
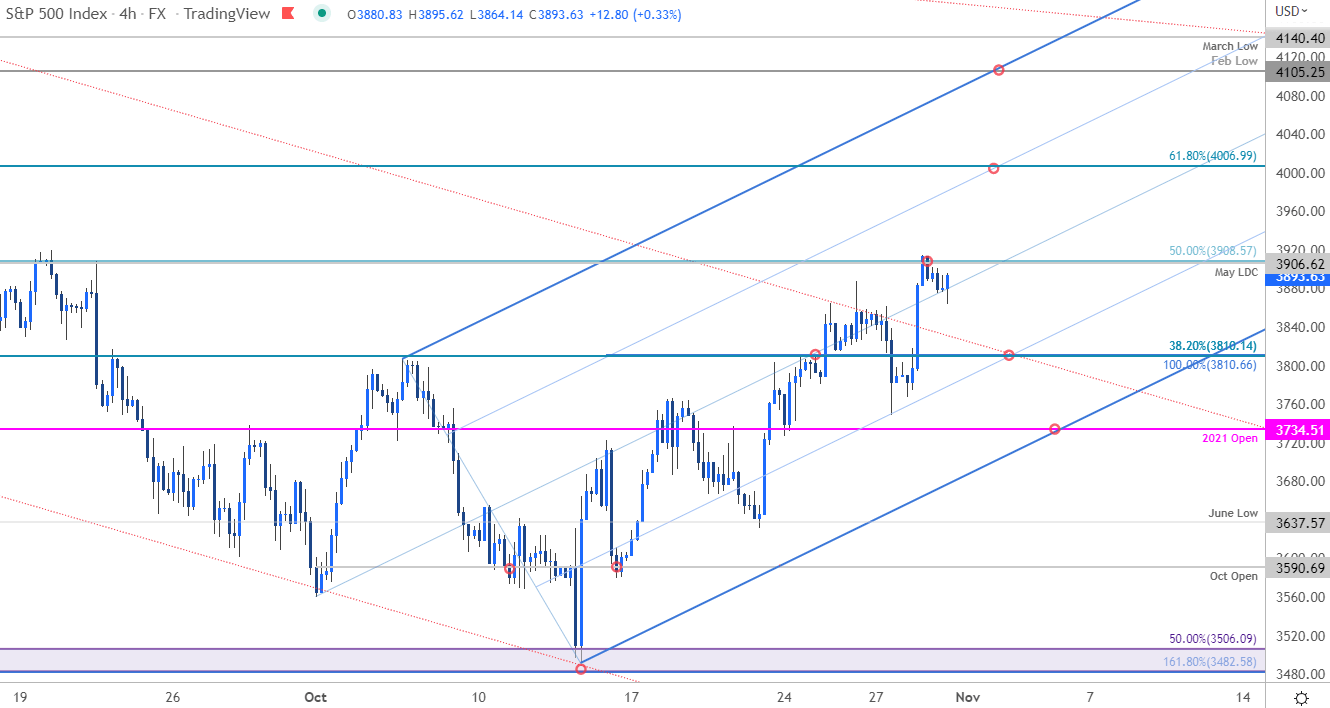
Chart Prepared by Michael Boutros, Technical Strategist; SPX500 on Tradingview
I’ve been tracking this S&P 500 short-term technical setup for more than two-weeks now and this ascending slope has continued to guide the recent advance with precision. Friday’s breakout extended into confluent resistance at 3906/08- a major pivot in price. The focus is on a reaction into this zone early in the week. Initial support rests at 3810 with near-term bullish invalidation now raised to 3734. A topside breach from here exposes the 75% parallel / 61.8% retracement near ~4006 and the upper parallel / February lows at 4105.
For a complete breakdown of Michael’s trading strategy, review his Foundations of Technical Analysis series on Building a Trading Strategy
Economic Calendar
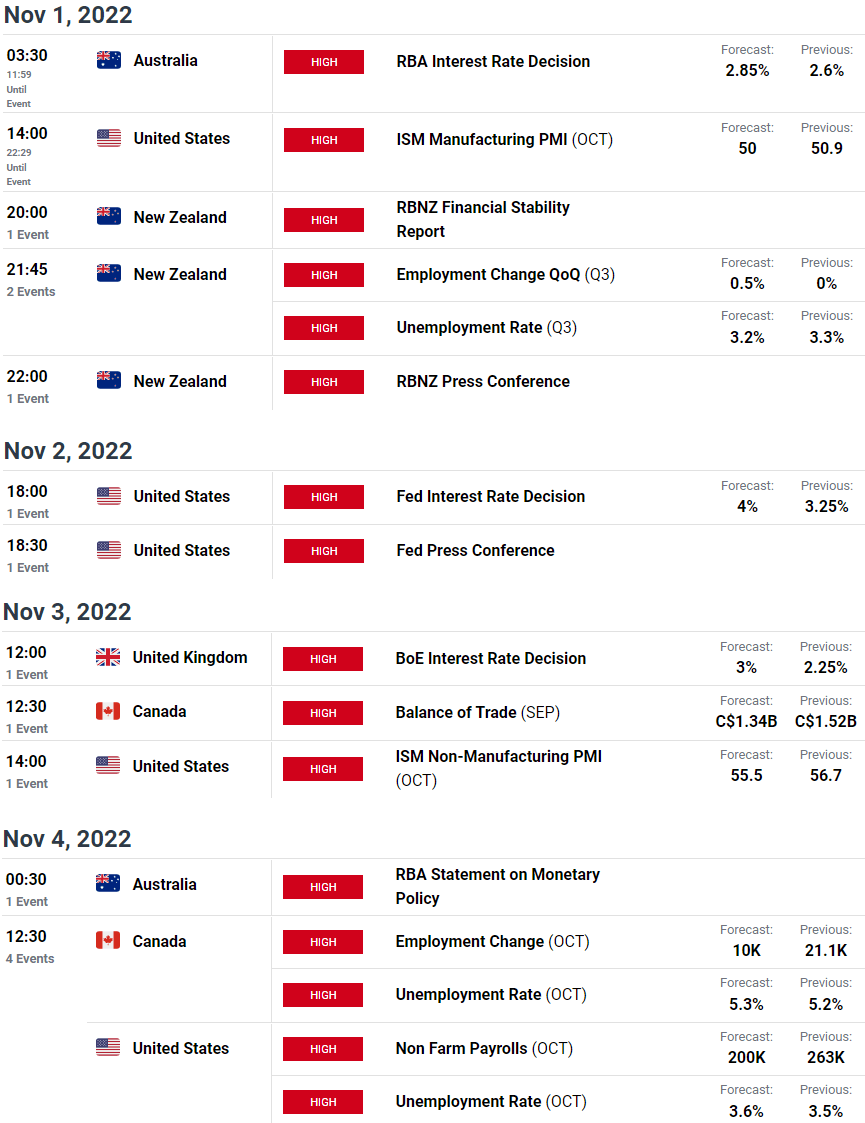
Economic Calendar - latest economic development and upcoming event risk

---Written by Michael Boutros, Technical Strategist with DailyFX
Follow Michael on Twitter @MBForex


