
FTSE 100 Live

FTSE 100
Bullish
 7h
7h
Last updated:
Jul 26, 2024
| Low | |
| High |
of clients are net long.
of clients are net short.
Average True Range
Total Intraday Range (% of ATR)
Note: Low and High figures are for the trading day.
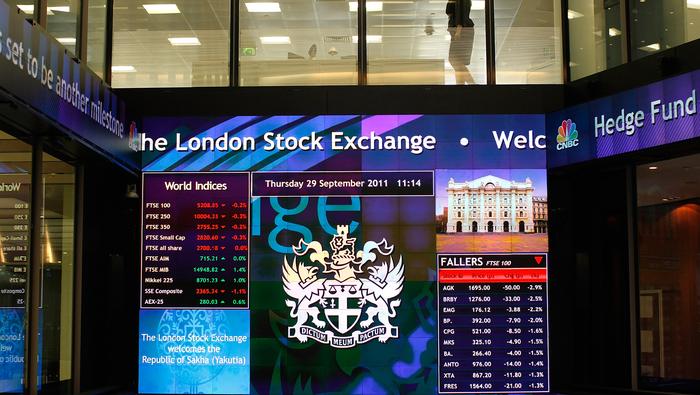
The FTSE 100 is a stock index representing the performance of the largest 100 companies listed on the London Stock Exchange (LSE) by market capitalization. The FTSE 100 stock index offers traders high liquidity and a reliable picture of UK economic health. Follow the FTSE 100 live with the chart and read our latest news and analysis. Plan your trades with the FTSE forecast, the economic calendar and learn about relevant events to assist your fundamental analysis.
Advertisement
News & Analysis

FTSE 100, S&P 500 and Nikkei 225 all Fall Sharply
2024-07-25 11:00:23

FTSE 100 bounce slows, while S&P 500 pushes higher and Nikkei 225 drops back
2024-07-23 11:00:00
Retail Trader Sentiment Analysis – FTSE 100, GBP/USD, and EUR/GBP
2024-07-22 07:54:24
While FTSE 100 remains range bound, DAX 40 and S&P 500 see days of losses
2024-07-19 11:00:40
FTSE 100 holds support, while Dax struggles, but Dow surges to fresh highs
2024-07-17 11:00:12
FTSE 100, DAX 40 and S&P 500 Begin Week on a Cautious Note
2024-07-15 10:00:14
FTSE 100, DAX 40 on track for third straight day of gains as Russell 2000 rallies by over 3.5%
2024-07-12 10:00:04
Real Time News

Jul 19, 2024
Follow
Indices Update: As of 14:00, these are your best and worst performers based on the London trading schedule:
US 500: -0.38%
Wall Street: -0.69%
FTSE 100: -0.71%
France 40: -0.89%
Germany 40: -0.97%
View the performance of all markets via https://t.co/2NUaqnUPED https://t.co/Dncphl5UIk

Jul 19, 2024
Follow
Indices Update: As of 13:00, these are your best and worst performers based on the London trading schedule:
US 500: -0.07%
Wall Street: -0.31%
FTSE 100: -0.66%
Germany 40: -0.72%
France 40: -0.79%
View the performance of all markets via https://t.co/2NUaqnUPED https://t.co/oLcQSVzeIj

Jul 19, 2024
Follow
Indices Update: As of 10:00, these are your best and worst performers based on the London trading schedule:
US 500: -0.09%
Wall Street: -0.20%
FTSE 100: -0.51%
Germany 40: -0.87%
France 40: -1.05%
View the performance of all markets via https://t.co/2NUaqnUPED https://t.co/zHIwe9EDDv


IG Client Sentiment
FTSE 100
Bullish
Daily change in
Longs
-30%
Shorts
25%
OI
2%
Weekly change in
Longs
-44%
Shorts
44%
OI
0%
Advertisement


Advertisement